
Climate Migration in Serbia: Quantification Using a Difference-in-Differences Approach
Article Sidebar
Main Article Content
Abstract
This study examines whether the municipalities classified as flood-affected during the May 2014 floods experienced a differential change in formally registered internal out-migration relative to non-flooded municipalities. The analysis uses a balanced municipality-year panel for 2009–2018, comprising 40 flood-affected and 125 non-flooded municipalities, with municipality and calendar-year fixed effects. The primary estimate is positive but imprecise (0.239 per 1,000 residents; 95% CI: −0.423 to 0.901). A restricted matched-sample estimate is larger but also imprecise, while a specification allowing NUTS2 region-specific annual shocks produces a larger positive estimate. Event-study and placebo diagnostics provide no statistical evidence of differential pre-treatment changes, although their confidence intervals are wide. Exploratory analyses suggest that estimated responses may vary by selected pre-flood municipal characteristics, but they do not identify household-level mechanisms. The findings do not support a single specification-invariant estimate of a positive average flood effect; they show that the estimated municipality-level association is sensitive to the comparison group and the treatment of regional annual shocks.
1 Introduction
Contemporary population dynamics are increasingly shaped by climate change and natural disasters, which simultaneously elevate population exposure to environmental hazards and strain existing adaptation mechanisms (Piguet, 2022; Intergovernmental Panel on Climate Change [IPCC], 2023; Zickgraf, 2021). Spatial mobility has historically been one of the primary strategies for adapting to environmental risks (McLeman & Smit, 2006; Berlemann & Tran, 2020; Sakdapolrak et al., 2024). However, it rarely operates as an isolated response; the mechanism through which hydrological and meteorological disasters translate into migration patterns depends heavily on the endogenous characteristics of the affected areas, such as the degree of agrarian dependence, income levels, population structures, and household living arrangements (Black et al., 2011; Niva et al., 2021; Yao et al., 2026).
Despite the intensification of international scientific discourse, the domestic literature lacks systematic empirical research in this domain. Specifically, longitudinal studies on the migration behavior of affected populations are absent, as are advanced econometric models capable of isolating the net effect of climate factors from other explanatory variables. With few exceptions (e.g., Vasić, 2026; Bakić & Trnavčević, 2026; Gligorijević & Bakić, 2025), climate determinants are not incorporated into migration modelling, or the preparation of official demographic projections.
This paper focuses on the May 2014 floods — the most severe hydrological disaster in modern Serbian history, which caused an estimated EUR 1.7 billion in damages and threatened the livelihoods of hundreds of thousands of households. Specifically, this study examines whether the May 2014 floods were associated with a differential change in formally registered internal out-migration from the flood-affected Serbian municipalities relative to non-flooded counterfactuals. The analysis utilizes a balanced municipality-year panel dataset covering the 2009–2018 period, employing a Difference-in-Differences (DiD) design with municipality and calendar-year fixed effects. Furthermore, it examines whether the estimated municipality-level responses varied across the selected pre-flood demographic and labor-market characteristics. Because the outcome variable is an aggregate administrative measure, the analysis evaluates changes in formally registered out-migration at the municipal level and does not identify household-level migration decisions or underlying micro-mechanisms.
The paper poses a fundamental research question: Did the municipalities classified as flood-affected in 2014 experience a differential change in the annual rate of formally registered internal out-migration during the 2014–2018 period relative to the non-flooded municipalities? The results integrate this specific case of flooding into the broader international body of empirical findings on the impact of climate change and natural disasters on population dynamics.
The paper is organized as follows: Section 2 sets out the aspirations and capabilities framework alongside the international empirical literature on floods and migration; Section 3 presents the data and the DiD methodology; Section 4 outlines the baseline model results and robustness tests; Section 5 discusses the findings within both international and local contexts; and Section 6 concludes with policy implications.
2 Environmental Degradation and Migration
2.1 From linear to mediated models
Early theoretical models — neoclassical theory and the basic push–pull concept — viewed the link between climate change and migration as a linear dependency: climate change degrades income sources, and the population emigrates as a result. These models work well for irreversible processes such as sea-level rise (IPCC, 2023), but they do not explain population response to sudden disasters such as floods, or to slow-onset processes such as droughts. When facing a flood, a population primarily strives for local (in situ) adaptation to reduce exposure (Black et al., 2011; Dillenardt et al., 2022; Lee et al., 2018; Zander et al., 2023), and permanent relocation is activated as a “last line of defense” only when adaptation — crop diversification, alternative employment, government aid — fails to preserve the household’s economic viability.
Later frameworks, primarily NELM (New Economics of Labor Migration) and the Foresight Framework, insist that the link between environmental factors and emigration is mediated and non-linear (De Sherbinin et al., 2022; Stojanov et al., 2021). In the medium term, through a financial lens, environmental factors can affect contemporaneous migration responses in two ways: positive rainfall effects can raise agricultural income and thus finance planned movement (Marchiori et al., 2017), while devastating floods acutely erode means of subsistence and temporarily raise the probability of forced internal relocation (Bubeck et al., 2020; Oskorouchi & Sousa-Poza, 2021; Sheldon & Zhan, 2022). At the same time, households in rural and predominantly agricultural areas are more prone to this kind of migration, most often short-distance, toward wealthier urban centers (Hoffmann et al., 2024).
2.2 The aspirations and capabilities framework
This study draws on the aspirations–capabilities framework, initially formulated by Carling (2002) and subsequently refined by Carling and Schewel (2018) and De Haas (2021). The framework is useful because flood exposure may alter incentives to migrate and the resources required to realize migration in potentially opposite directions.
Several propositions follow from this dichotomous model that are absent from linear models. First, a natural disaster such as a flood acts as a trigger for individuals with pre-existing migration intentions, accelerating planned departure (De Haas, 2021; McLeman & Smit, 2006). Second, for poorer households the same factor can paradoxically reduce emigration: by depleting financial capital, housing stock, and agricultural assets, the flood imposes tight budget constraints that prevent covering the costs of emigration (Cattaneo et al., 2019; Kleemans, 2015). This mechanism produces the phenomenon of “trapped populations” -individuals who are hit hardest yet least able to leave the threatened zone, thereby becoming doubly vulnerable (Black & Collyer, 2014; Foresight, 2011). Third, the framework also enables the analysis of a conscious desire to stay – voluntary immobility – which is often neglected in the research focused exclusively on financial possibilities (Schewel, 2020). “Retention” factors tied to family, local identity, and community vary significantly by age and social group (Sengupta, 2025; Mata-Codesal, 2014).
The framework was developed to explain household and individual decisions. The present study does not observe household preferences, resources, mobility constraints, destinations, or individual migration trajectories. Municipal out-migration rates therefore represent the net aggregate result of heterogeneous household responses. The framework is used as an interpretive lens for limited municipality-level expectations, not as a directly tested micro-level mechanism.
Applied to Serbia, the framework motivates the expectation that municipality-level responses may be heterogeneous. Flood exposure may be associated with higher formally registered out-migration in some municipalities and weaker or negative aggregate responses in others. Exploratory analyses examine whether this pattern varies with selected pre-flood demographic and labor-market characteristics. Evidence from European flood studies makes both mobility and immobility pathways plausible, but it cannot be assumed to transfer directly to the Serbian context (Bubeck et al., 2020; Birkmann et al., 2023).
3 Methodology
3.1 Data and variables
The study covers the period 2009-2018, which provides a five-year pre-treatment interval and a five-year post-treatment interval to analyze the short-and medium-term consequences of the May 2014 floods. The cut-off at 2018 was introduced to reduce the influence of subsequent external shocks, particularly the COVID-19 pandemic. The unit of analysis is the municipality-year.
The dependent variable is the annual rate of formally registered internal out-migration, expressed as the number of persons registered as changing their permanent residence from one municipality to another during a calendar year per 1,000 estimated residents of the municipality. The measure captures registered changes of permanent residence rather than all residential mobility. It may therefore undercount temporary, circular, informal, or unregistered moves, and it does not identify the destination municipality or the household-level reasons for moving. The data on the number of persons registered as persons changing their permanent residence and the data of estimated residents of the municipality each year, are taken from the database of the Statistical Office of the Republic of Serbia, the internal migration section — forms PP1 and PP2 for registration and deregistration of permanent residence (Statistical Office of the Republic of Serbia, 2023).
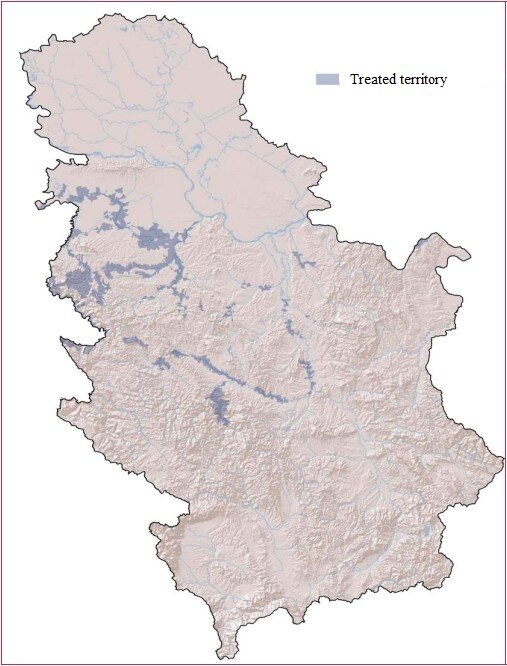
The key independent variable is flood exposure. It is operationalized as a binary indicator in the primary specification. Because the primary exposure measure is binary and the available intensity information was not used as a harmonized continuous treatment measure, we do not interpret these analyses as a dose-response test of flood severity. The flood-exposure indicator is taken from the analysis by Đorđević and Stanković (2015), who, on the basis of satellite imagery and census data on population distribution, identified 40 municipalities affected by the flood (Šabac, Loznica, Vladimirci, Koceljeva, Krupanj, Ljubovija, Mali Zvornik, Valjevo, Lajkovac, Ljig, Mionica, Osečina, Ub, Jagodina, Despotovac, Paraćin, Svilajnac, Čačak, Gornji Milanovac, Lučani, Lazarevac, Obrenovac, Surčin, Čukarica, Kragujevac, Topola, Bajina Bašta, Kosjerić, Požega, Sremska Mitrovica, Pećinci, Ruma, Šid, Varvarin, Trstenik, Kladovo, Malo Crniće, Velika Plana, Smederevska Palanka, Kraljevo). Most treated municipalities are concentrated in the NUTS2 regions of Šumadija and Western Serbia (Figure 1).
Figure 1. Spatial distribution of treated and control municipalities
Source: Đorđević and Stanković (2015)
All demographic, socio-economic, and spatial control variables are taken from the publication Municipalities and Regions (Statistical Office of the Republic of Serbia, 2015).
3.2 The Difference-in-Differences method
The primary specification is (Equation 1):
Here, Eᵢ ₜ is the rate of formally registered internal out-migration in municipality i and year t; Floodᵢ identifies the municipalities classified as flood-affected in 2014; Post ₜ equals one for 2014–2018; μᵢ and λₜ are municipality and calendar-year fixed effects; and standard errors are clustered by municipality. The coefficient β estimates the average differential post-2014 change in the outcome for the flood-affected municipalities relative to the non-flooded municipalities (Wooldridge, 2010; Karymshakov et al., 2024).
The primary DiD model used the full balanced panel of these 40 flood-affected municipalities and the remaining 125 municipalities in Serbia classified as non-flooded in 2014. This specification therefore retains the complete analytical sample and estimates the average differential change in formally registered out-migration after 2014 in the flood-affected municipalities relative to the non-flooded municipalities. The primary specification does not include time-varying demographic, economic, or spatial covariates, because after 2014 such variables may have themselves been affected by flood exposure or by migration. These characteristics are used descriptively, in the construction of the matched sensitivity sample, and in separate heterogeneity analyses where appropriate.
The parallel-trends assumption is assessed with an event-study specification using 2013 as the reference year and with a placebo DiD restricted to 2009–2013. These diagnostics are interpreted as compatible with, but not conclusive evidence for the parallel trends because their confidence intervals are wide (Figure 2).
Figure 2. Conceptualization of the Difference-in-Differences model on the example of out-migration dynamics before and after the flood (in ‰)
3.3 Sensitivity and exploratory analyses
As a sensitivity analysis, we constructed a restricted matched comparison sample using one-to-one optimal matching without replacement, constrained within the NUTS2 regions. The matching was based exclusively on five pre-flood municipal characteristics: (i) mean out-migration rate during 2009–2013; (ii) the natural logarithm of estimated population in 2013; (iii) mean age in 2013; (iv) employment per 1,000 residents in 2013; and (v) the share of utilized agricultural land in the total municipal area in 2013. All continuous matching variables were Z-standardized before matching. No post-2014 outcomes or covariates were used in construction of the matched sample.
We used a Hungarian-algorithm implementation to obtain the one-to-one assignment with the minimum total Euclidean distance among eligible treated–control pairs. We imposed two pair-level calipers: standardized Euclidean distance across the five covariates could not exceed 2.5, and the absolute standardized difference on any individual covariate could not exceed 1.5 standard deviations. The procedure yielded 33 treated–control pairs. Because seven flood-affected municipalities had no admissible non-flooded control municipality within their NUTS2 region, estimates from this matched sample are interpreted as a restricted-sample sensitivity analysis, rather than as the primary estimate for all flood-affected municipalities. The matched control municipalities and complete pair assignments are reported in Appendix Table A1.
To examine heterogeneity, we estimate separate interaction models in which the Flood × Post term is interacted with each centered pre-flood municipal characteristic. These models assess whether the aggregate post-flood change in formally registered out-migration differed by baseline demographic structure and local labor-market conditions. They are interpreted as analyses of municipality-level heterogeneity, not as direct tests of household-level mechanisms. Mean age in 2013 and employment per 1,000 residents in 2013 were used as pre-flood municipal vulnerability. Mean age captures baseline demographic structure, while employment per 1,000 residents captures local labor-market conditions. Both variables were measured before the May 2014 flood and were therefore not affected by subsequent flood exposure or migration responses (Appendix Table A2).
4 Results
4.1 Descriptive statistics
Table 1 describes the full municipality-year panel. Across the entire sample, flood-affected and non-flooded municipalities display broadly similar average demographic profiles. The mean age was 43.59 years in flood-affected municipalities compared to 43.29 years in non-flooded localities, while life expectancy was 72.50 and 71.96 years, respectively. The average shares of pre-school, school-age, working-age, and fertile population segments were also closely aligned across both groups. Crucially, these descriptive similarities do not establish parallel trends; the plausibility of the DiD design is evaluated separately using pre-flood migration trajectories and event-study estimates.
| Indicator | Unit | Full sample | Flood-affected | Non-flooded |
|---|---|---|---|---|
| Municipalities | municipalities | 165 | 40 | 125 |
| Municipality-year observations | municipality-years | 1,650 | 400 | 1,250 |
| Estimated population | persons | 43,042 (46,625) | 47,198 (42,774) | 41,712 (47,732) |
| Out-migration rate | per 1,000 residents | 16.99 (6.14) | 16.63 (3.59) | 17.10 (6.75) |
| Average age | years | 43.36 (2.93) | 43.59 (1.78) | 43.29 (3.21) |
| Life expectancy at birth | years | 72.09 (1.81) | 72.50 (1.34) | 71.96 (1.92) |
| Pre-school population | % | 6.1 (1.2) | 5.9 (0.8) | 6.1 (1.3) |
| School-age population | % | 8.0 (1.4) | 7.9 (0.7) | 8.0 (1.6) |
| Working-age population | % | 66.2 (3.5) | 66.4 (2.4) | 66.1 (3.8) |
| Fertile population | % | 21.1 (2.3) | 21.0 (1.5) | 21.2 (2.5) |
| Utilized agricultural land | % | 58.9 (32.2) | 57.3 (21.6) | 59.4 (34.9) |
| Average wages | RSD | 35,559 (8,959) | 37,298 (9,763) | 35,002 (8,616) |
| Employed persons | per 1,000 residents | 224.5 (188.6) | 207.2 (63.1) | 230.1 (213.4) |
| Unemployed persons | per 1,000 residents | 109.9 (47.3) | 90.1 (34.4) | 116.3 (49.1) |
| Population density | residents per km² | 419.9 (1,865.7) | 109.7 (171.9) | 519.2 (2,132.0) |
| Source: Authors’ calculations. | ||||
Several economic and spatial characteristics differ more visibly across the two categories. Flood-affected municipalities exhibited higher average wages (37,298 versus 35,002 RSD), but lower employment (207.2 versus 230.1 employed persons per 1,000 residents) and lower unemployment (90.1 versus 116.3 unemployed persons per 1,000 residents). They also featured a slightly smaller average share of utilized agricultural land (57.3% versus 59.4%) and markedly lower population density (109.7 versus 519.2 residents per km²). These differences characterize the baseline composition of the analytical sample; they are not interpreted as causal effects of flood exposure, nor do they constitute sufficient evidence that the groups were strictly comparable prior to 2014.
Table 2 presents the annual mean rates of formally registered internal out-migration across flood-affected and non-flooded municipalities. Prior to the disaster, average out-migration rates were marginally lower in the municipalities subsequently classified as flood-affected. Specifically, the mean rate in affected areas rose from 16.71 per 1,000 residents in 2013 to 17.16 in 2014 and 17.29 in 2015, before declining in subsequent years. Non-flooded municipalities also exhibited pronounced annual variation. Consequently, these unadjusted descriptive patterns do not, on their own, establish a sustained differential post-flood increase in out-migration.
| Group | 2009 | 2010 | 2011 | 2012 | 2013 | 2014 | 2015 | 2016 | 2017 | 2018 |
|---|---|---|---|---|---|---|---|---|---|---|
| Full sample | 16.90 | 16.92 | 16.15 | 16.59 | 16.96 | 17.19 | 17.23 | 17.68 | 16.96 | 17.33 |
| Flood-affected municipalities | 16.36 | 16.54 | 15.49 | 16.18 | 16.71 | 17.16 | 17.29 | 17.04 | 16.65 | 16.91 |
| Non-flooded municipalities | 17.07 | 17.04 | 16.36 | 16.73 | 17.04 | 17.20 | 17.21 | 17.89 | 17.05 | 17.46 |
| Source: Authors’ calculations. | ||||||||||
4.2 Primary and matched DiD estimates
Table 3 reports the static DiD estimates. The primary specification uses the full balanced panel of 40 flood-affected and 125 non-flooded municipalities (1,650 municipality-year observations), with municipality and calendar-year fixed effects and standard errors clustered by municipality.
| Specification | Sample | N | Fixed effects | Estimate (per 1,000) | 95% CI | p value | Role |
|---|---|---|---|---|---|---|---|
| Primary DiD: full sample | 40 affected; 125 non-flooded | 1,650 | Municipality + year | 0.239 | −0.423 to 0.901 | 0.480 | Primary estimate |
| Matched sensitivity | 33 affected; 33 matched controls | 660 | Municipality + year | 0.807 | −0.044 to 1.657 | 0.068 | Restricted sample |
| Regional-year sensitivity | 40 affected; 125 non-flooded | 1,650 | Municipality + NUTS2 × year | 0.920 | 0.124 to 1.715 | 0.024 | Regional shocks |
| Pre-flood placebo | 40 future affected; 125 non-flooded | 825 | Municipality + year | 0.258 | −0.538 to 1.053 | 0.523 | Pre-trend diagnostic |
|
Source: Authors’ calculations.
Note: Standard errors are clustered by municipality. The placebo model uses 2009–2013 and defines the placebo post-period as 2012–2013. |
|||||||
In the primary model, the Flood × Post coefficient is 0.239 per 1,000 residents (95% CI: −0.423 to 0.901; p = 0.480). The estimate is positive but imprecise: the interval includes no differential change as well as modest negative and positive effects. The full-sample analysis therefore does not provide precise evidence of an average positive increase in registered out-migration after the floods.
The matched-sample analysis restricts the comparison to 33 flood-affected municipalities and 33 non-flooded municipalities selected within the NUTS2 regions using five pre-flood characteristics. It improves observed baseline comparability but changes the target population because seven flood-affected municipalities could not be matched.
In the matched sample, the coefficient is 0.807 per 1,000 residents (95% CI: −0.044 to 1.657; p = 0.068). Although larger than the full-sample estimate, it also includes zero. The difference between the two estimates indicates sensitivity to the construction of the counterfactual; it does not establish that either specification is uniquely correct.
The full balanced-panel specification remains primary because it corresponds directly to the study’s main estimate: the average differential post-2014 change across all municipalities classified as flood-affected. The matched model is reported as a restricted-sample sensitivity analysis.
4.3 Robustness to regional annual shocks
The primary model assumes that annual shocks are common across Serbia. To relax this assumption, the model was re-estimated with municipality and NUTS2 region-by-year fixed effects, allowing each region to have its own annual shock. The coefficient is 0.920 per 1,000 residents (95% CI: 0.124 to 1.715; p = 0.024), compared with 0.239 (95% CI: −0.423 to 0.901; p = 0.480) in the primary specification.
The larger regional-year estimate indicates sensitivity to the treatment of region-specific time-varying factors. It does not demonstrate that this specification is uniquely correct, nor does it address local shocks or spatial spillovers within regions. It is therefore reported as a complementary robustness analysis rather than a replacement for the primary model.
4.4 Dynamic estimates
Figure 3 and Table 4 report the event-study estimates, with 2013 specified as the reference year. Each coefficient measures the difference in the out-migration rate between the flood-affected and non-flooded municipalities in a given year relative to the corresponding difference in 2013. The pre-flood coefficients for 2009–2012 are all negative in sign, but individually statistically indistinguishable from zero. Their joint Wald test also does not reject the null hypothesis that the pre-treatment coefficients are jointly zero (p = 0.718). Thus, the available data do not provide statistical evidence that the municipalities later classified as flood-affected were already following a different out-migration trajectory before the May 2014 floods. However, the confidence intervals around these estimates are wide. The event study should therefore be interpreted as compatible with, rather than as definitive proof of the parallel-trends assumption.
Figure 3. Event-study estimates of the differential out-migration rate relative to 2013
| Year | Period | Effect (per 1,000) | 95% CI | p value |
|---|---|---|---|---|
| 2009 | Pre-flood | −0.384 | −1.435 to 0.666 | 0.471 |
| 2010 | Pre-flood | −0.179 | −1.160 to 0.802 | 0.719 |
| 2011 | Pre-flood | −0.534 | −1.425 to 0.357 | 0.238 |
| 2012 | Pre-flood | −0.217 | −0.846 to 0.413 | 0.498 |
| 2013 | Reference | 0 (reference) | Not estimated | — |
| 2014 | Flood year | 0.285 | −0.415 to 0.984 | 0.423 |
| 2015 | Post-flood | 0.409 | −0.470 to 1.289 | 0.360 |
| 2016 | Post-flood | −0.524 | −1.366 to 0.319 | 0.221 |
| 2017 | Post-flood | −0.072 | −0.856 to 0.712 | 0.856 |
| 2018 | Post-flood | −0.217 | −0.991 to 0.556 | 0.580 |
| Source: Authors’ calculations. | ||||
The post-flood coefficients do not show a stable or sustained pattern. The estimated relative change is positive in 2014 (0.285 per 1,000 residents) and 2015 (0.409), but neither estimate is statistically distinguishable from zero. The 2014 coefficient should be interpreted particularly cautiously, because the annual migration rate includes the months preceding the May floods. The estimate becomes negative in 2016 (−0.524) and remains close to zero in 2017 (−0.072) and 2018 (−0.217); again, none of these estimates excludes zero. Taken together, the dynamic results do not support an interpretation of a precisely estimated and persistent increase in the formally registered out-migration throughout the 2014–2018 period. They are compatible with a possible short-run increase immediately after the flood, but the annual data do not provide sufficiently precise evidence to establish either the magnitude or the persistence of that response.
4.5 Exploratory heterogeneity
The exploratory heterogeneity analyses suggest that the estimated municipality-level association between flood exposure and formally registered out-migration may vary with pre-flood demographic structure and local labor-market conditions (Table 5). The interaction with mean age in 2013 was negative (−1.073 per 1,000 residents per standard deviation; 95% CI: −2.100 to −0.046; p = 0.041), indicating that the estimated Flood × Post association was smaller in municipalities with a higher baseline mean age. The estimated marginal effect was 1.358 per 1,000 residents in municipalities one standard deviation below the mean age (95% CI: 0.229 to 2.488), 0.285 at the mean (95% CI: −0.350 to 0.921), and −0.788 one standard deviation above the mean (95% CI: −2.068 to 0.493). Thus, the estimates are compatible with a more positive aggregate post-flood migration response in relatively younger municipalities, but they do not establish a negative response in older municipalities.
| Moderator | Triple interaction(95% CI; p value) | DiD effect at −1 SD(95% CI) | DiD effect at mean (95% CI) | DiD effect at +1 SD(95% CI) |
|---|---|---|---|---|
| Mean age in 2013(one SD) | −1.073(−2.100 to −0.046; p = 0.041) | 1.358(0.229 to 2.488) | 0.285(−0.350 to 0.921) | −0.788(−2.068 to 0.493) |
| Employment per 1,000 residents in 2013(one SD) | 1.650(0.008 to 3.292; p = 0.049) | −1.281(−2.868 to 0.307) | 0.370(−0.313 to 1.052) | 2.020(0.072 to 3.967) |
|
Source: Authors’ calculations.
Note: Separate models. All effects are per 1,000 residents; 95% confidence intervals are shown in parentheses. Standard errors are clustered by municipality. |
||||
The interaction with employment per 1,000 residents in 2013 was positive (1.650 per 1,000 residents per standard deviation; 95% CI: 0.008 to 3.292; p = 0.049), indicating that the estimated Flood × Post association was larger in municipalities with higher baseline employment. The estimated marginal effects were −1.281 per 1,000 residents at one standard deviation below the mean employment level (95% CI: −2.868 to 0.307), 0.370 at the mean (95% CI: −0.313 to 1.052), and 2.020 one standard deviation above the mean (95% CI: 0.072 to 3.967). This pattern is compatible with variation in aggregate municipal responses across baseline labor-market conditions. It does not demonstrate that households in high-employment municipalities had greater resources to migrate, nor that lower-employment municipalities experienced trapped populations.
These findings are exploratory. The interaction estimates are nominally significant but borderline, the marginal confidence intervals are wide, and the analyses examine only two moderators in a limited number of treated municipalities. They should therefore be interpreted as possible heterogeneity in municipality-level responses, not as robust evidence of causal moderation or household-level migration mechanisms.
5 Discussion
The results provide a cautious and mixed picture of the relationship between the 2014 floods and registered internal out-migration in Serbia. The primary DiD estimate is positive, but it is not sufficiently precise to rule out no average differential change. The matched comparison produces a larger estimate, but its confidence interval also includes zero. By contrast, the model allowing the NUTS2 regions to have separate year-specific shocks produces a positive and statistically distinguishable estimate. These differences do not establish that one specification is correct and the others are wrong. Rather, they show that the estimated average association depends on the construction of the comparison group and on how regional changes over time are modeled.
This pattern is consistent with the broader literature on environmental change and migration, which does not support a simple expectation that disasters invariably produce more out-migration. Environmental shocks may disrupt livelihoods and housing, creating stronger incentives to move. At the same time, the same shock may reduce income, damage assets, and constrain the resources required for relocation. The net result can therefore differ across populations and settings (Black et al., 2011; Cattaneo et al., 2019; De Haas, 2021). The present results cannot distinguish these channels, but they are compatible with the possibility that different municipal responses offset one another in the overall average.
The event-study estimates add an important temporal perspective. They do not show a statistically detectable difference in migration dynamics between the future flood-affected and the non-flooded municipalities before 2014. The placebo analysis leads to the same conclusion. However, the pre-treatment confidence intervals are wide, so these tests should not be read as proving that the parallel-trends assumption holds. After 2014, the estimated association is positive in 2014 and 2015, but it is not precisely estimated and does not persist through 2016–2018. This means that the available annual data do not support the claim of a sustained increase in formally registered out-migration after the floods.
The fact that the 2014 outcome includes months before the May floods also requires caution in interpreting the first post-flood coefficient. Any immediate migration response is likely to be only partly captured in the annual rate for 2014. More generally, the outcome measures changes in registered permanent residence. It does not capture temporary displacement, circular mobility, unregistered moves, or short-term household strategies. This distinction matters, because post-disaster mobility may take several forms, including temporary relocation and local adaptation, before it appears as a permanent administrative change of residence (McLeman & Smit, 2006; Bubeck et al., 2020; Dillenardt et al., 2022).
The exploratory heterogeneity analysis suggests that estimated municipal responses may vary depending on the pre-flood demographic structure and local labor-market conditions. The association is smaller in municipalities with a higher mean age and larger in municipalities with higher baseline employment. These patterns are broadly compatible with the aspirations–capabilities perspective: the resources and constraints that existed before a shock may shape the scope for migration after it. However, this interpretation must remain limited. The interaction estimates are borderline, their marginal confidence intervals are wide, and municipality-level indicators cannot reveal whether individual households had the resources, desire, or opportunity to move. The results therefore indicate possible heterogeneity in aggregate municipal responses, not a test of household-level mechanisms (Carling & Schewel, 2018; De Haas, 2021; Schewel, 2020).
The sensitivity to regional year effects deserves particular attention. Flood-affected municipalities are spatially concentrated, especially in Šumadija and Western Serbia. Allowing each NUTS2 region to have its own annual shock may capture regional labor-market developments, recovery conditions, infrastructure changes, or other time-varying factors that are not common across the country. At the same time, regional year fixed effects do not fully resolve spatial dependence or possible spillovers into nearby control municipalities. A future analysis using documented municipal adjacency, geographical distances, or a harmonized continuous flood-exposure measure could examine these issues more directly. Such extensions would improve the distinction between direct flood exposure, regional shocks, and spatially connected migration responses.
The study nevertheless makes a useful contribution by documenting what the available administrative municipal panel can and cannot establish. The evidence does not support a uniform and robust average increase in the registered out-migration across all flood-affected municipalities. It instead points to uncertainty around the average effect, sensitivity to plausible specifications, and possible differences across the pre-flood municipal conditions. This is substantively important for policy: recovery and demographic planning should not assume that all flood-affected municipalities respond in the same way. Policies designed around local recovery, housing, labor-market conditions, and the needs of populations with limited mobility may be more appropriate than a single migration-focused response (Birkmann et al., 2023; Stanković et al., 2020).
6 Conclusion
This study examined whether the May 2014 floods were associated with a differential change in formally registered internal out-migration from flood-affected municipalities in Serbia. Using a balanced municipality-year panel for 2009–2018, the primary Difference-in-Differences specification compared 40 flood-affected municipalities with 125 non-flooded municipalities, while accounting for time-invariant municipal differences and annual shocks common to all municipalities. The primary estimate was positive, but imprecise. It therefore does not provide a precise basis for concluding that the floods generated an average increase in formally registered out-migration across all the affected municipalities.
The additional analyses qualify rather than reverse this conclusion. The restricted matched-sample analysis yielded a larger positive point estimate, but its confidence interval also included zero. The event-study and placebo analyses did not provide statistical evidence of differential pre-treatment changes, although their confidence intervals were wide and could not conclusively establish the parallel-trends assumption. The post-flood event-study estimates were positive in 2014 and 2015 but were not statistically distinguishable from zero and did not show a sustained positive pattern through 2018. By contrast, the specification with the NUTS2 region-by-year fixed effects produced a larger positive estimate. Taken together, these results show that the estimated municipality-level association is sensitive to the composition of the comparison group and to assumptions about regional time-varying conditions.
The findings are consistent with the broader view that environmental shocks do not produce a uniform migration response. Flood exposure may increase incentives to move in some settings while simultaneously reducing the resources required for mobility in others. The exploratory heterogeneity analyses suggest that estimated aggregate responses may differ according to pre-flood mean age and local employment conditions. However, the interaction estimates are borderline, the marginal confidence intervals are wide, and the analysis uses aggregate municipal measures. These patterns should therefore not be interpreted as evidence that particular households were either enabled or constrained to migrate.
The study also highlights important measurement and design limits. The outcome captures formally registered changes in permanent residence, not temporary displacement, circular mobility, or unregistered relocation. The annual value for 2014 includes months before the May floods. In addition, municipality-clustered standard errors address serial correlation within municipalities, but do not fully address potential spatial dependence or spillovers across nearby municipalities. The region-by-year specification partly accommodates broad regional shocks, but it does not replace a geographically defined spatial analysis.
The results nevertheless have practical implications for post-disaster planning. They caution against assuming that flood exposure will necessarily produce a uniform or persistent increase in registered out-migration. Recovery and demographic policies should consider local differences in demographic structure, labor-market conditions, housing recovery, and the capacity of residents to adapt in place or relocate. Future research should combine administrative municipal panels with household-level longitudinal data, harmonized measures of flood intensity, and geographic information on municipal proximity. Such evidence would make it possible to distinguish temporary displacement from permanent migration, assess spatial spillovers, and test the household-level mechanisms proposed by the aspirations–capabilities framework more directly.
The work is the result of research financed/supported by the Ministry of Science, Technological Development and Innovation of the Republic of Serbia, according to the Agreement on the Implementation and Financing of Scientific Research Work No. 451-03-33/2026-03/200091 as well as the Science Fund of the Republic of Serbia, 7358, Population dynamics in the context of environmental challenges in Serbia - POPENVIROS.
Data availability statement
Data are available from the corresponding author upon request.
Generative AI declaration
During the preparation of this work, the author(s) used generative AI tools solely to assist with language editing and formatting of references in APA 7 style. The author(s) reviewed and edited all outputs and take full responsibility for the content of the publication.
Coauthor contributions
Vera Gligorijević: Conceptualization, Formal Analysis, Investigation, Methodology, Project Administration, Supervision, Visualization, Writing - Original Draft
Damjan Bakić: Conceptualization, Data Curation, Formal Analysis, Methodology, Visualization, Writing - Review & Editing
Filip Mijušković: Conceptualization, Data Curation, Formal Analysis, Methodology, Visualization, Writing - Review & Editing
References
- Bakić, D., & Trnavčević, N. (2026). Proceedings of the 11th of the Scientific-Professional Meeting "Local self-government in planning and development of spaces and settlements” (V. Šećerov, D. Ristić, Z. Radosavljević, & M. Jeftić, Eds.). https://scindeksclanci.ceon.rs/data/pdf/proc0080/LSPUPN%20Zbornik%20radova%202026_online.pdf
- Berlemann, M., & Tran, T. X. (2020). Climate-related hazards and internal migration: Empirical evidence for rural Vietnam. Economics of Disasters and Climate Change, 4, 385-409. https://doi.org/10.1007/s41885-020-00062-3
- Birkmann, J., Schüttrumpf, H., Handmer, J., Thieken, A., Kuhlicke, C., Truedinger, A., Sauter, H., Klopries, E.-M., Greiving, S., Jamshed, A., Merz, B., Solecki, W., & Kirschbauer, L. (2023). Strengthening resilience in reconstruction after extreme events - Insights from flood affected communities in Germany. International Journal of Disaster Risk Reduction, 96(103965). https://doi.org/10.1016/j.ijdrr.2023.103965
- Black, R., & Collyer, M. (2014). Populations “trapped” at times of crisis. Forced Migration Review, 45, 52-56. https://pure-oai.bham.ac.uk/ws/files/109384827/black_collyer_English.pdf
- Black, R., Bennett, S. R. G., Thomas, S. M., & Beddington, J. R. (2011). Climate change: Migration as adaptation. Nature, 478(7370), 447-449. https://doi.org/10.1038/478477a
- Bubeck, P., Berghäuser, L., Hudson, P., & Thieken, A. H. (2020). Using panel data to understand the dynamics of human behavior in response to flooding. Risk Analysis, 40(11), 2340-2359. https://doi.org/10.1111/risa.13548
- Carling, J. (2002). Migration in the age of involuntary immobility: Theoretical reflections and Cape Verdean experiences. Journal of Ethnic and Migration Studies, 28(1), 5-42. https://doi.org/10.1080/13691830120103912
- Carling, J., & Schewel, K. (2018). Revisiting aspiration and ability in international migration. Journal of Ethnic and Migration Studies, 44(6), 945-963. https://doi.org/10.1080/1369183X.2017.1384146
- Cattaneo, C., Beine, M., Fröhlich, C. J., Kniveton, D., Martinez-Zarzoso, I., Mastrorillo, M., Millock, K., Piguet, E., & Schraven, B. (2019). Human migration in the era of climate change. Review of Environmental Economics and Policy, 13(2), 189-206. https://doi.org/10.1093/reep/rez008
- De Haas, H. (2021). A theory of migration: The aspirations-capabilities framework. Comparative Migration Studies, 9(1). https://doi.org/10.1186/s40878-020-00210-4
- De Sherbinin, A., Grace, K., McDermid, S., Van der Geest, K., Puma, M. J., & Bell, A. (2022). Migration theory in climate mobility research. Frontiers in Climate, 4(82343). https://doi.org/10.3389/fclim.2022.882343
- Dillenardt, L., Hudson, P., & Thieken, A. H. (2022). Urban pluvial flood adaptation: Results of a household survey across four German municipalities. Journal of Flood Risk Management, 15(3), e12748. https://doi.org/10.1111/jfr3.12748
- Foresight. (2011). Migration and global environmental change: Final project report. The Government Office for Science. https://www.un.org/development/desa/pd/sites/www.un.org.development.desa.pd/files/unpd-cm10201202-11-1116-migration-and-global-environmental-change.pdf
- Gligorijević, V., & Bakić, D. (2025). Proceedings of the Twelfth scientific-expert meeting with international participation "Planned and normative protection of space and environment", 275-282, Vršac (D. Filipović, V. Šečerov, D. Ristić, & M. Ilić, Eds.). https://scindeks-clanci.ceon.rs/data/pdf/proc-0044/2025/proc-00442502275G.pdf
- Hoffmann, R., Abel, G., Malpede, M., Muttarak, R., & Percoco, M. (2024). Drought and aridity influence internal migration worldwide. Nature Climate Change, 14(12), 1245-1253. https://doi.org/10.1038/s41558-024-02165-1
- Intergovernmental Panel on Climate Change (IPCC). (2023). Climate change 2022: Impacts, adaptation and vulnerability. Cambridge University Press. https://doi.org/10.1017/9781009325844
- Karymshakov, K., Aseinov, D., & Azhgaliyeva, D. (2024). Drought and Migration: Evidence from the Kyrgyz Republic. Asian Development Bank Institute. https://doi.org/10.56506/ilsu5435
- Kleemans, M. (2015). Migration choice under risk and liquidity constraints. Unknown. https://doi.org/10.22004/ag.econ.200702
- Lee, E., Kim, H., & Song, J. (2018). The impacts of natural disasters on population outflow: Focusing on the flood. Journal of the Korean Society of Hazard Mitigation, 18(7), 137-147. https://doi.org/10.9798/kosham.2018.18.7.137
- Marchiori, L., Maystadt, J.-F., & Schumacher, I. (2017). Is environmentally induced income variability a driver of human migration?. Migration and Development, 6(1), 33-59. https://doi.org/10.1080/21632324.2015.1020106
- Mata-Codesal, D. (2014). From “mud” to “migration”: Internal migration aspirations and immobility in highland Ecuador. Population. REMHU: Revista Interdisciplinar DaMobilidade Humana, 22(42), 263-280. https://doi.org/10.1590/s1980-85852014000100016
- McLeman, R., & Smit, B. (2006). Migration as an adaptation to climate change. Climatic Change, 76(1-2), 31-53. https://doi.org/10.1007/s10584-005-9000-7
- Niva, V., Kallio, M., Muttarak, R., Taka, M., Varis, O., & Kummu, M. (2021). Global migration is driven by the complex interplay between environmental and social factors. Environmental Research Letters, 16(11), 114019. https://doi.org/10.1088/1748-9326/ac2e86
- Oskorouchi, H. R., & Sousa-Poza, A. (2021). Floods, food security, and coping strategies: Evidence from Afghanistan. Agricultural Economics, 52(1), 123-140. https://doi.org/10.1111/agec.12610
- Piguet, E. (2022). Linking climate change, environmental degradation, and migration: An update after 10 years. WIREs Climate Change, 13(1), e746. https://doi.org/10.1002/wcc.746
- Sakdapolrak, P., Borderon, M., & Sterly, H. (2024). The limits of migration as adaptation: A conceptual approach towards the role of immobility, disconnectedness and simultaneous exposure in translocal livelihoods systems. Climate and Development, 16(2), 87-96. https://doi.org/10.1080/17565529.2023.2180318
- Schewel, K. (2020). Understanding immobility: Moving beyond the mobility bias in migration studies. International Migration Review, 54(2), 328-355. https://doi.org/10.1177/0197918319831952
- Sengupta, M. (2025). Environmental immobility: A systematic review of empirical research. Ambio, 54(11), 1729-1756. https://doi.org/10.1007/s13280-025-02195-9
- Sheldon, T. L., & Zhan, C. (2022). The impact of hurricanes and floods on domestic migration. Journal of Environmental Economics and Management, 115(102726). https://doi.org/10.1016/j.jeem.2022.102726
- Stanković, J., Tomić, Z., & Stanković, J. (2020). Socio-economic impact of natural disasters in the Republic of Serbia. Economic Analysis, 53(2), 20-38. https://doi.org/10.28934/ea.20.53.2.pp20-38
- Statistical Office of the Republic of Serbia. (2015). Opštine i regioni u Republici Srbiji 2015 [Municipalities and regions in the Republic of Serbia 2015]. https://publikacije.stat.gov.rs/G2015/PdfE/G20152017.pdf
- Statistical Office of the Republic of Serbia. (2023). Metadata. Internal Migrations of the Population. https://data.stat.gov.rs/Home/Result/180602?languageCode=sr-Cyrl
- Stojanov, R., Rosengaertner, S., de Sherbinin, A., & Nawrotzki, R. (2021). Climate mobility and development cooperation. Population and Environment, 43(2), 209-231. https://doi.org/10.1007/s11111-021-00387-5
- Vasić, P. (2026). Izveštaj o projekciji stanovništva pod uticajem izazova životne sredine u Republici Srbiji, [Report on population projection under the influence of environmental challenges in the Republic of Serbia], (Project POPENVIROS - Research report D8.1). University of Belgrade - Faculty of Geography. https://rs.popenviros-prizma.com/biblioteka-2/izvestaji/#
- Wooldridge, J. M. (2010). Econometric analysis of cross section and panel data. MIT Press. https://ipcid.org/evaluation/apoio/Wooldridge%20-%20Cross-section%20and%20Panel%20Data.pdf
- Yao, L., Tan, S., Lv, C., Wang, N., Yoshida, Y., & Long, Y. (2026). Climate change adaptation must consider older people. Nature Human Behaviour, 10(3), 443-446. https://doi.org/10.1038/s41562-026-02402-x
- Zander, K. K., Nguyen, D., Mirbabaie, M., & Garnett, S. T. (2023). Aware but not prepared: Understanding situational awareness during the century flood in Germany in 2021. International Journal of Disaster Risk Reduction, 96(103936). https://doi.org/10.1016/j.ijdrr.2023.103936
- Zickgraf, C. (2021). Climate change, slow onset events and human mobility: Reviewing the evidence. Current Opinion in Environmental Sustainability, 50, 21-30. https://doi.org/10.1016/j.cosust.2020.11.007
- Đorđević, L., & Stanković, V. (2015). Analiza uticaja šteta od elementarnih nepogoda na rezultate popisa [Analysis of the impact of damage from natural disasters on census results]. Statistical Office of the Republic of Serbia. https://publikacije.stat.gov.rs/G2015/Pdf/G20154008.pdf
Appendix A. Matched-sample diagnostics
| NUTS2 region | Flood-affected | Matched non-flooded control | Euclidean distance | Largest absolute difference (SD) |
|---|---|---|---|---|
| Belgrade Region | LAZAREVAC | ZEMUN | 1.488 | 1.204 |
| Belgrade Region | OBRENOVAC | MLADENOVAC | 0.991 | 0.823 |
| Belgrade Region | SURČIN | GROCKA | 1.098 | 0.724 |
| Belgrade Region | ČUKARICA | VOŽDOVAC | 1.012 | 0.783 |
| Southern and Eastern Serbia Region | KLADOVO | KUČEVO | 0.746 | 0.495 |
| Southern and Eastern Serbia Region | MALO CRNIĆE | ŽABARI | 0.500 | 0.390 |
| Southern and Eastern Serbia Region | SMEDEREVSKA PALANKA | PETROVAC NA MLAVI | 1.216 | 0.808 |
| Southern and Eastern Serbia Region | VELIKA PLANA | ALEKSINAC | 1.015 | 0.812 |
| Vojvodina Region | PEĆINCI | BELA CRKVA | 0.627 | 0.428 |
| Vojvodina Region | RUMA | VRŠAC | 0.449 | 0.282 |
| Vojvodina Region | SREMSKA MITROVICA | BAČKA PALANKA | 0.609 | 0.413 |
| Vojvodina Region | ŠID | KOVIN | 0.545 | 0.388 |
| Šumadija and Western Serbia Region | BAJINA BAŠTA | VRNJAČKA BANJA | 0.360 | 0.267 |
| Šumadija and Western Serbia Region | DESPOTOVAC | IVANJICA | 1.056 | 0.877 |
| Šumadija and Western Serbia Region | GORNJI MILANOVAC | ĆUPRIJA | 0.499 | 0.422 |
| Šumadija and Western Serbia Region | JAGODINA | ARANĐELOVAC | 0.539 | 0.511 |
| Šumadija and Western Serbia Region | KOCELJEVA | BATOČINA | 0.580 | 0.367 |
| Šumadija and Western Serbia Region | KOSJERIĆ | BRUS | 0.503 | 0.343 |
| Šumadija and Western Serbia Region | KRUPANJ | ARILJE | 1.229 | 0.865 |
| Šumadija and Western Serbia Region | LJIG | NOVA VAROŠ | 0.442 | 0.299 |
| Šumadija and Western Serbia Region | LJUBOVIJA | RAŠKA | 1.558 | 1.401 |
| Šumadija and Western Serbia Region | LOZNICA | PRIJEPOLJE | 1.258 | 0.860 |
| Šumadija and Western Serbia Region | LUČANI | ČAJETINA | 0.857 | 0.495 |
| Šumadija and Western Serbia Region | MALI ZVORNIK | PRIBOJ | 1.360 | 0.873 |
| Šumadija and Western Serbia Region | MIONICA | ĆIĆEVAC | 0.623 | 0.467 |
| Šumadija and Western Serbia Region | OSEČINA | REKOVAC | 1.345 | 1.302 |
| Šumadija and Western Serbia Region | POŽEGA | ALEKSANDROVAC | 0.505 | 0.454 |
| Šumadija and Western Serbia Region | TOPOLA | LAPOVO | 1.433 | 1.180 |
| Šumadija and Western Serbia Region | UB | BOGATIĆ | 0.265 | 0.215 |
| Šumadija and Western Serbia Region | VALJEVO | GRAD UŽICE | 0.651 | 0.520 |
| Šumadija and Western Serbia Region | VARVARIN | KNIĆ | 0.621 | 0.505 |
| Šumadija and Western Serbia Region | VLADIMIRCI | RAČA | 0.764 | 0.562 |
| Šumadija and Western Serbia Region | ČAČAK | KRUŠEVAC | 0.327 | 0.279 |
|
Source: Authors’ calculations.
Note: Matching used the five pre-flood characteristics specified in Section 3.3; all pairs satisfy the stated caliper rules. |
||||
| Pre-flood characteristic | Absolute standardized mean difference |
|---|---|
| Mean out-migration rate, 2009–2013 | 0.004 |
| Log estimated population, 2013 | 0.073 |
| Mean age, 2013 | 0.096 |
| Employment per 1,000 residents, 2013 | 0.092 |
| Utilized agricultural land share, 2013 | 0.125 |
|
Source: Authors’ calculations.
Note: Values below 0.10 are often used as a descriptive balance benchmark. The agricultural-land share remains slightly above that benchmark. |
|
Article Details
Published by the Institute of Social Sciences - Center for Demographic Research




References
Berlemann, M., & Tran, T. X. (2020). Climate-related hazards and internal migration: Empirical evidence for rural Vietnam. Economics of Disasters and Climate Change, 4, 385-409. https://doi.org/10.1007/s41885-020-00062-3
Birkmann, J., Schüttrumpf, H., Handmer, J., Thieken, A., Kuhlicke, C., Truedinger, A., Sauter, H., Klopries, E.-M., Greiving, S., Jamshed, A., Merz, B., Solecki, W., & Kirschbauer, L. (2023). Strengthening resilience in reconstruction after extreme events - Insights from flood affected communities in Germany. International Journal of Disaster Risk Reduction, 96(103965). https://doi.org/10.1016/j.ijdrr.2023.103965
Black, R., & Collyer, M. (2014). Populations “trapped” at times of crisis. Forced Migration Review, 45, 52-56. https://pure-oai.bham.ac.uk/ws/files/109384827/black_collyer_English.pdf
Black, R., Bennett, S. R. G., Thomas, S. M., & Beddington, J. R. (2011). Climate change: Migration as adaptation. Nature, 478(7370), 447-449. https://doi.org/10.1038/478477a
Bubeck, P., Berghäuser, L., Hudson, P., & Thieken, A. H. (2020). Using panel data to understand the dynamics of human behavior in response to flooding. Risk Analysis, 40(11), 2340-2359. https://doi.org/10.1111/risa.13548
Carling, J. (2002). Migration in the age of involuntary immobility: Theoretical reflections and Cape Verdean experiences. Journal of Ethnic and Migration Studies, 28(1), 5-42. https://doi.org/10.1080/13691830120103912
Carling, J., & Schewel, K. (2018). Revisiting aspiration and ability in international migration. Journal of Ethnic and Migration Studies, 44(6), 945-963. https://doi.org/10.1080/1369183X.2017.1384146
Cattaneo, C., Beine, M., Fröhlich, C. J., Kniveton, D., Martinez-Zarzoso, I., Mastrorillo, M., Millock, K., Piguet, E., & Schraven, B. (2019). Human migration in the era of climate change. Review of Environmental Economics and Policy, 13(2), 189-206. https://doi.org/10.1093/reep/rez008
De Haas, H. (2021). A theory of migration: The aspirations-capabilities framework. Comparative Migration Studies, 9(1). https://doi.org/10.1186/s40878-020-00210-4
De Sherbinin, A., Grace, K., McDermid, S., Van der Geest, K., Puma, M. J., & Bell, A. (2022). Migration theory in climate mobility research. Frontiers in Climate, 4(82343). https://doi.org/10.3389/fclim.2022.882343
Dillenardt, L., Hudson, P., & Thieken, A. H. (2022). Urban pluvial flood adaptation: Results of a household survey across four German municipalities. Journal of Flood Risk Management, 15(3), e12748. https://doi.org/10.1111/jfr3.12748
Foresight. (2011). Migration and global environmental change: Final project report. The Government Office for Science. https://www.un.org/development/desa/pd/sites/www.un.org.development.desa.pd/files/unpd-cm10201202-11-1116-migration-and-global-environmental-change.pdf
Gligorijević, V., & Bakić, D. (2025). Proceedings of the Twelfth scientific-expert meeting with international participation "Planned and normative protection of space and environment", 275-282, Vršac (D. Filipović, V. Šečerov, D. Ristić, & M. Ilić, Eds.). https://scindeks-clanci.ceon.rs/data/pdf/proc-0044/2025/proc-00442502275G.pdf
Hoffmann, R., Abel, G., Malpede, M., Muttarak, R., & Percoco, M. (2024). Drought and aridity influence internal migration worldwide. Nature Climate Change, 14(12), 1245-1253. https://doi.org/10.1038/s41558-024-02165-1
Intergovernmental Panel on Climate Change (IPCC). (2023). Climate change 2022: Impacts, adaptation and vulnerability. Cambridge University Press. https://doi.org/10.1017/9781009325844
Karymshakov, K., Aseinov, D., & Azhgaliyeva, D. (2024). Drought and Migration: Evidence from the Kyrgyz Republic. Asian Development Bank Institute. https://doi.org/10.56506/ilsu5435
Kleemans, M. (2015). Migration choice under risk and liquidity constraints. Unknown. https://doi.org/10.22004/ag.econ.200702
Lee, E., Kim, H., & Song, J. (2018). The impacts of natural disasters on population outflow: Focusing on the flood. Journal of the Korean Society of Hazard Mitigation, 18(7), 137-147. https://doi.org/10.9798/kosham.2018.18.7.137
Marchiori, L., Maystadt, J.-F., & Schumacher, I. (2017). Is environmentally induced income variability a driver of human migration?. Migration and Development, 6(1), 33-59. https://doi.org/10.1080/21632324.2015.1020106
Mata-Codesal, D. (2014). From “mud” to “migration”: Internal migration aspirations and immobility in highland Ecuador. Population. REMHU: Revista Interdisciplinar DaMobilidade Humana, 22(42), 263-280. https://doi.org/10.1590/s1980-85852014000100016
McLeman, R., & Smit, B. (2006). Migration as an adaptation to climate change. Climatic Change, 76(1-2), 31-53. https://doi.org/10.1007/s10584-005-9000-7
Niva, V., Kallio, M., Muttarak, R., Taka, M., Varis, O., & Kummu, M. (2021). Global migration is driven by the complex interplay between environmental and social factors. Environmental Research Letters, 16(11), 114019. https://doi.org/10.1088/1748-9326/ac2e86
Oskorouchi, H. R., & Sousa-Poza, A. (2021). Floods, food security, and coping strategies: Evidence from Afghanistan. Agricultural Economics, 52(1), 123-140. https://doi.org/10.1111/agec.12610
Piguet, E. (2022). Linking climate change, environmental degradation, and migration: An update after 10 years. WIREs Climate Change, 13(1), e746. https://doi.org/10.1002/wcc.746
Sakdapolrak, P., Borderon, M., & Sterly, H. (2024). The limits of migration as adaptation: A conceptual approach towards the role of immobility, disconnectedness and simultaneous exposure in translocal livelihoods systems. Climate and Development, 16(2), 87-96. https://doi.org/10.1080/17565529.2023.2180318
Schewel, K. (2020). Understanding immobility: Moving beyond the mobility bias in migration studies. International Migration Review, 54(2), 328-355. https://doi.org/10.1177/0197918319831952
Sengupta, M. (2025). Environmental immobility: A systematic review of empirical research. Ambio, 54(11), 1729-1756. https://doi.org/10.1007/s13280-025-02195-9
Sheldon, T. L., & Zhan, C. (2022). The impact of hurricanes and floods on domestic migration. Journal of Environmental Economics and Management, 115(102726). https://doi.org/10.1016/j.jeem.2022.102726
Stanković, J., Tomić, Z., & Stanković, J. (2020). Socio-economic impact of natural disasters in the Republic of Serbia. Economic Analysis, 53(2), 20-38. https://doi.org/10.28934/ea.20.53.2.pp20-38
Statistical Office of the Republic of Serbia. (2015). Opštine i regioni u Republici Srbiji 2015 [Municipalities and regions in the Republic of Serbia 2015]. https://publikacije.stat.gov.rs/G2015/PdfE/G20152017.pdf
Statistical Office of the Republic of Serbia. (2023). Metadata. Internal Migrations of the Population. https://data.stat.gov.rs/Home/Result/180602?languageCode=sr-Cyrl
Stojanov, R., Rosengaertner, S., de Sherbinin, A., & Nawrotzki, R. (2021). Climate mobility and development cooperation. Population and Environment, 43(2), 209-231. https://doi.org/10.1007/s11111-021-00387-5
Vasić, P. (2026). Izveštaj o projekciji stanovništva pod uticajem izazova životne sredine u Republici Srbiji, [Report on population projection under the influence of environmental challenges in the Republic of Serbia], (Project POPENVIROS - Research report D8.1). University of Belgrade - Faculty of Geography. https://rs.popenviros-prizma.com/biblioteka-2/izvestaji/#
Wooldridge, J. M. (2010). Econometric analysis of cross section and panel data. MIT Press. https://ipcid.org/evaluation/apoio/Wooldridge%20-%20Cross-section%20and%20Panel%20Data.pdf
Yao, L., Tan, S., Lv, C., Wang, N., Yoshida, Y., & Long, Y. (2026). Climate change adaptation must consider older people. Nature Human Behaviour, 10(3), 443-446. https://doi.org/10.1038/s41562-026-02402-x
Zander, K. K., Nguyen, D., Mirbabaie, M., & Garnett, S. T. (2023). Aware but not prepared: Understanding situational awareness during the century flood in Germany in 2021. International Journal of Disaster Risk Reduction, 96(103936). https://doi.org/10.1016/j.ijdrr.2023.103936
Zickgraf, C. (2021). Climate change, slow onset events and human mobility: Reviewing the evidence. Current Opinion in Environmental Sustainability, 50, 21-30. https://doi.org/10.1016/j.cosust.2020.11.007
Đorđević, L., & Stanković, V. (2015). Analiza uticaja šteta od elementarnih nepogoda na rezultate popisa [Analysis of the impact of damage from natural disasters on census results]. Statistical Office of the Republic of Serbia. https://publikacije.stat.gov.rs/G2015/Pdf/G20154008.pdf