
Population Ageing and Gender Gap: A Dual Challenge to Economic Growth
Article Sidebar
Main Article Content
Abstract
Population ageing is one of the most significant social challenges in the modern globalized world. This demographic shift is causing potential labour shortages, a higher old-age dependency ratio, increased healthcare expenses and additional pressure on social services. These trends raise concerns about inter-generational equity and the unsustainability of pension systems. This paper investigates the impact of old-age dependency and gender inequality on economic growth in 35 European countries from 2000 to 2022 by employing the quantile regression method. Our research findings indicate that population ageing significantly and adversely impacts economic growth across all quantiles. Specifically, a 1% increase in the share of older persons in the working-age population is linked with a reduced economic output ranging from 0.03% to 0.07%. The negative effects of population ageing are particularly pronounced in high-income countries with greater economic dependency on an ageing population. Gender inequality measured by the gender inequality index jeopardizes economic growth in most quantiles, with its effects being more evident in the middle and higher quantiles, particularly at the 60th and 70th. However, it is essential to note that while statistically significant, the magnitude of this effect is relatively small: a 1% increase in gender inequality measured by gender inequality index is associated with only a 0.002–0.005% decrease in economic growth. Nonetheless, even such modest impacts may carry important implications for fostering inclusive and sustainable growth over the long term. In addition, enhancing legal and regulatory protection for women positively contributes to economic growth, especially in countries with the lowest and highest GDP per capita. We find that a 1% decrease in gender inequality, measured by the Women, Business and Law Index, is associated with a 0.08-0.16% increase in economic growth.
1 INTRODUCTION
Population ageing is emerging as a significant global demographic trend, transforming societies worldwide and presenting various macroeconomic challenges. Equally significant, ongoing gender inequalities influence labour markets and economic performance. These two phenomena are closely linked and mutually reinforcing. The rising number of older individuals, coupled with persistent gender inequalities, presents serious obstacles to sustainable economic development. According to United Nations (UN) projections, by 2050, the number of people over 65 will be twice that of children under the age of 5 (United Nations 2024). While population ageing has initially become pronounced in high-income countries, low- and middle-income nations are now experiencing the most significant changes, with projections indicating that by 2050, two-thirds of the global population over 60 will live in these countries (WHO 2022).
Medical advances have improved the quality of life of older adults and increased life expectancy, contributing to these demographic shifts. As the share of older workers in the labour force increases, the structure of the labour supply evolves, which may lead to reduced productivity and economic performance (Calvo-Sotomayor et al. 2019;Cristea et al. 2020;Maestas et al. 2023). Population ageing has a potentially double negative impact on public finances through a decline in contributions and other forms of taxation (on the revenue side) and a rise in spending on pensions, healthcare, and social assistance (on the expenditure side). Labour force shortage must bear a more significant tax burden to finance social benefits, including pensions and other social services (Filipović and Miljković 2024). In the short term, managing the risks and impacts of ageing requires controlling expenditures, developing practical solutions in pension policy and long-term care systems, and alleviating extreme poverty among senior citizens. In the medium term, these negative consequences can be partially mitigated through longer working lives, a sufficient supply of jobs, healthy ageing, and increased investment in the skills of older individuals (Cylus and Al Tayara 2021;Matković 2022).
Moreover, as the working-age population shrinks due to ageing, addressing gender inequality becomes an economic imperative. Reducing gender employment gaps, particularly by removing legal, institutional, and cultural barriers, could facilitate greater female labour force participation and raise the long-run GDP per capita by nearly 20%, thereby fostering more inclusive economic growth (World Bank 2024). In this context, gender-inclusive policies can be seen as a strategic response to population ageing as they help to mitigate its adverse economic effects.
However, it should be pointed out that the rapid shift toward ageing societies does not necessarily pose an economic threat. Including older individuals in economic and social life through various adaptation programs and investments in human capital can create long-term development opportunities. Older populations can lead to more automation because of a lack of middle-aged workers. This situation encourages the development and use of robotics, especially in the sectors that depend on manual labour (Acemoglu and Restrepo 2022). As a result, we could expect increased productivity, a reduced share of labour in the economy, and a rise in the global trade of automation technologies. Additionally, increased investment in information and communication technologies (ICTs) can boost productivity and extend the working age of older workers (Lee and Song 2020).
To examine the impact of population ageing and gender inequalities on economic performance, we employ the quantile regression on a sample of 35 European countries from 2000 to 2022. To the best of our knowledge, our study is one of the first, alongside Pham and Vo (2021) and Koengkan et al. (2022), to analyse the impact of population ageing on economic growth through quantile regression analysis. Although earlier studies have examined this relationship, our findings contribute to the field by providing estimates of the dependent variable at each specific point of the conditional distribution, using European countries as a sample. Our central hypothesis (H1) posits that population ageing hinders economic growth. Additionally, we test two further hypotheses: that gender inequalities negatively impact economic performance (H2) and that improving legal and regulatory opportunities for women’s economic participation and entrepreneurship fosters economic growth (H3).
The structure of the paper is as follows: Section 2 reviews the empirical literature on the link between population ageing and gender inequality as determinants, and economic growth as the outcome measure. Section 3 explains the model and data used in the empirical analysis, while Section 4 presents the results and their interpretation. The final section concludes and discusses policy recommendations for European countries.
2 LITERATURE REVIEW
Our literature review is organised into two primary sections; the first offers a brief overview of the relationship between population ageing and economic outlook, while the second investigates the connection between economic performance and gender inequality.
2.1 STUDIES ON THE NEXUS OF POPULATION AGEING AND ECONOMIC GROWTH
The issue of population ageing has raised divergent opinions regarding its economic implications (Papapetrou and Tsalaporta 2020;Mamun et al. 2020;Cylus and Al Tayara 2021;Lee and Shin 2021;Williams et al. 2022;Park and Shin 2023). Most empirical studies have detected a negative relationship between these two variables. For example, Pan and Chang (2021) examine 27 economies in Asia in the period 1995-2016, Maestas et al. (2023) focus on the United States in the period 1980-2010, and Kotschy and Bloom (2023) investigate 145 countries in the period 1950-2015, all finding a negative nexus between population ageing and economic growth. The ageing population leads to a decrease in working-age population, which potentially slows economic growth and innovation, as young people are essential for technological advancement and are labelled as the bearers of societal changes, creativity, and investments (Roblek et al. 2019). Simultaneously, the rising elderly population strains pension and healthcare systems, potentially jeopardising the sustainability of social funds and increasing public debt (Cho and Dong-Eun 2024). Furthermore, population ageing can result in higher energy consumption due to increased demands for heating, medical care, and living arrangements, as well as changes in behaviour, technology adoption, and infrastructure needs that influence overall energy use (Pais-Magalhães et al. 2022).
Jayawardhana et al. (2023) investigate the causal relationship between economic growth and the elderly population in 15 European countries from 1961 to 2021. Based on Granger causality testing, the authors find a one-way causal link between economic growth and the elderly population in Luxembourg, Austria, Denmark, Spain, and Sweden, while identifying the opposite tendency in Greece and the UK. By applying wavelet coherence analysis, the authors demonstrate that the elderly population negatively affected economic growth in the 1960s, whereas in the 1980s and 1990s, economic growth negatively influenced the elderly population. In a more recent study, Mihajlović and Miladinov (2024) investigate how the old-age dependency ratio affects economic growth in eight emerging and seven advanced EU countries from 2000 to 2020. Their research indicates that the detrimental effect of the old-age dependency ratio on long-term per capita economic growth is found to be more significant in emerging CEE economies compared to their advanced EU counterparts. Similarly, Nicolini and Roig (2024) demonstrate that ageing and shrinking working-age populations harmed economic growth across EU regions from 2000 to 2020. However, they assert that immigration could be denoted as a growth driver, as it can help offset this decline by contributing to the labour force and supporting growth in ageing areas. This finding aligns with Lindh and Malmberg (2009), who find a hump-shaped relationship between age structure and economic growth in older EU countries, where higher shares of dependent age groups correlate with lower GDP growth. Ageing is expected to slow GDP growth across Europe, though the timing varies by country. However, the authors stress that avoiding declines in the working-age population through family and migration policies can significantly mitigate the negative effects of population ageing.
Lee and Shin (2019) examine the impact of population ageing on economic performance in 142 countries from 1960-2014. Based on their empirical results, the authors demonstrate that the impact of an ageing population on economic growth becomes negative only after a certain threshold is surpassed, and the effects become more evident as the population ageing increases. Likewise, Papapetrou and Tsalaporta (2020) conclude that a higher proportion of older individuals leads to slower real GDP growth, particularly in countries with low population growth rates, as evidenced by their study of 23 OECD countries. The empirical study by Maity and Sinha (2021), which focuses on the link between population ageing and economic growth in India, suggests that knowledge spillovers can ease the adverse effects of ageing on economic performance, by fostering a strong environment for knowledge exchange and innovation.
However, some studies challenge the view that population ageing negatively affects economic growth, suggesting that in specific contexts, the relationship may be positive (Mamun et al. 2020;Pham and Vo 2021;Liang et al. 2023;Seok and Kim 2024). By examining the 31 Chinese provinces from 2008 to 2019, Chen et al. (2022) argue that population ageing significantly impacts the economic outlook and expenditures for endowment insurance, medical and healthcare, and the development of economically disadvantaged regions. By analysing the period from 2013 to 2020 in the same provinces, Gao et al. (2023) reached similar findings. The authors conclude that while population ageing in the eastern and central regions drives technological innovation and positively impacts high-quality economic development, the western region experiences difficulties that constrain innovation and economic growth. Similar findings are also revealed by Temsumrit (2023) for a sample of 87 countries from 1996 to 2017, demonstrating that reallocating government spending from various categories towards education in an ageing society can foster long-term economic growth, whereas shifting resources toward cultural initiatives would lead to a slowdown in growth. The study by Pan and Chang (2021), which analyses 27 economies in Asia from 1995 to 2016, indicates that population ageing positively and significantly impacts the GDP growth rate in low-income and lower-middle-income economies while significantly negatively affecting GDP growth in high-income economies.
2.2 STUDIES ON THE NEXUS OF GENDER INEQUALITY AND ECONOMIC PERFORMANCE
The empirical studies on the link between economic growth and gender inequality provide evidence that gender disparities impede economic growth. The disparities between men and women in access to resources, education, as well as representation in labour force participation undermine overall economic performance, contributing to slower economic growth (Karoui and Feki 2018;Kam et al. 2022;Ngepah et al. 2024). They also limit human capital development, as women often face barriers to education, training, and job opportunities. Consequently, reducing gender gaps could stimulate economic growth through several transmission channels, including increased female labour force participation, enhanced human capital accumulation, improved labour market efficiency, and higher productivity growth (Rivic 2023;Bertay et al. 2025).
The prevailing perspective in the literature stresses the importance of gender parity in promoting economic development. In most papers, gender inequality is often measured by the gender inequality index, the gender development index, the gender wage gap, the female labour force participation rate, and political representation indicators, among others. Recent empirical studies carried out in the context of European countries highlight the complex association between gender disparities (in labour force participation, education and wage outcomes) and economic performance. By investigating the growth drivers in 21 EU countries from 2015 to 2019, Juhásová et al. (2023) find that progress towards gender parity is positively associated with GDP per capita, meaning that gender-balanced societies tend to exhibit better economic performance. By examining the same period, Ilić (2022) focuses on wage disparities in the Western Balkans, linking the enduring gender pay gap to historical and institutional factors. The author emphasizes that a common political and economic culture, deep-rooted gender segregation, and systemic discrimination are key determinants of the notable decline in GDP per capita. Nam et al. (2025) examine the effects of gender inequality on various economic outcomes, including trade, GDP per capita, and innovation, across the 27 EU member states from 1998 to 2022. Their results reveal that labour force disparities adversely impact trade and GDP per capita, while educational disparities obstruct innovation. Recognizing that gender gaps, whether in labor force participation or education, significantly influence economic performance, the authors advocate for a more comprehensive approach to gender policy. In addition, Nam et al. (2024) present comparable findings concerning European transition economies between 2000 and 2022. Their research indicates that while trade and financial liberalization usually promote economic growth, gender inequality serves as a moderating factor that diminishes these beneficial impacts. Consequently, the authors emphasize that addressing gender inequality is essential for enhancing trade liberalization and, in turn, stimulating economic growth.
Maitra and Ganguli (2024) analyse the link between gender development (measured by gender development index) and economic growth in India between 1971–2021 and 1990–2021. Their findings suggest that improving women’s health, education, and labour force participation could yield short-term and long-term economic growth benefits. Bertay et al. (2025) contribute to the literature by examining the impact of gender equality on economic growth in manufacturing industries across 65 emerging markets and developing economies (EMDEs) between 1990 and 2018. Their study shows that gender equality in the labour market facilitates the better utilisation of female labour, particularly in industries with higher female employment shares.
Altuzarra et al. (2021) explore the effects of various dimensions of gender inequality—education, labour market participation, and institutional representation—on economic growth using data from 105 developing countries between 1990 and 2017. Their study finds that gender equality in education significantly contributes to economic growth, especially in sub-Saharan African (SSA) countries. They also identify a positive relationship between women’s participation in parliaments and economic growth in the broader sample of developing countries, though this relationship was negative in SSA countries. Koengkan et al. (2022) investigate the impact of gender imbalances on the economic growth of 17 countries in the Latin America and Caribbean (LAC) region from 1990 to 2016. Their results indicate that gender inequality negatively affects GDP per capita, and as inequality increases across higher quantiles, economic growth in LAC countries declines. The authors stress the significance of policies that promote gender equality in the region by encouraging higher participation of women in the labour market, narrowing the gender pay gap, and tackling challenges such as violence against women, early pregnancies, and maternal mortality.
Akinwande et al. (2024) examine the causal relationship between gender inequality (measured by the Gender Parity Index), financial development, inflation, and economic growth in Nigeria from 1980 to 2020. The analysis shows that gender inequality helps predict economic growth over short-, medium-, and long-term periods, based on Granger causality testing. Their study advocates for policies that promote equal access to education for both boys and girls, reduce early marriages, and challenge cultural norms that hinder economic progress. Algül (2024) examines the relationship between gender inequality, particularly gender disparities in employment, and economic outcomes in a global sample of 73 countries from 1990 to 2022. The author finds that increasing gender inequality leads to higher female unemployment rates and a wider gender unemployment gap.
3 EMPIRICAL MODEL, VARIABLE DESCRIPTION AND DATA SOURCES
Our dataset is strongly balanced and consists of 35 European countries1 from 2000 to 2022. The data are sourced from the World Bank (World Development Indicators; Women, Business and the Law) and the United Nations Development Programme (UNDP). The dependent variable is the GDP per capita in constant 2015 US$ as the base year. The key explanatory variables, our primary focus, are the old-age, dependency ratio as % of the working-age population (15-64), the gender inequality index (by UNDP) and the Women, Business and the Law Index Score.
Following Pham and Vo (2021), we have used a panel quantile regression model to investigate the impact of population ageing on economic growth. Our model, however, primarily resorts to the growth rates of the variables included (constructed as the first differences of log values) (Eq. 1):
While βi and μt capture the country and time fixed effects, respectively, signs a1,τ to a6,τ refer to coefficients. ΔlnGDPi,t is the growth of real GDP per capita; lnOADRi,t stands for the log value of old-age dependency ratio as % of working-age population (the ratio of people older than 64, to the working age population (15-64)) as proxy for population ageing; ΔlnOPENi,t stands for the growth rate of trade (% of GDP) as a measure of economy openness; ΔlnLEBi,t is the growth rate of life expectancy at birth, total (years), often used as a measure of both population health and the health aspect of human capital assessment; ΔlnUNRi,t denotes the growth rate of the unemployment rate as a proxy for labour market conditions; ΔlnUPi,t is the growth rate of urban population as % of the total population; ΔlnGMi,t is a general variable that includes the growth rate of gender gaps which, to explore the effect of population ageing without gender gaps, we exclude from our first model specification (Model 1).
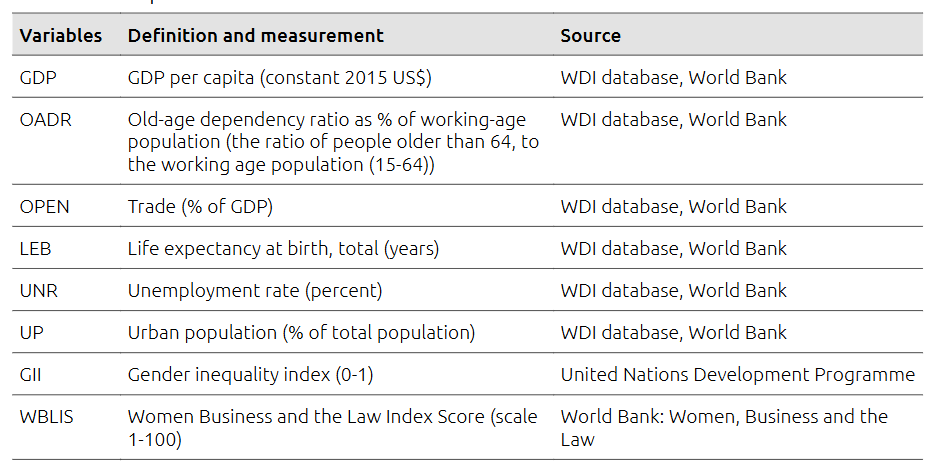
To assess the robustness of the effects of gender gaps on economic growth, we estimate two different specifications with two gender-related variables. The first (which we refer to as ΔlnGII), estimated in our Model 2, is based on the gender inequality index obtained from the UNDP. GII spans from 0, indicating gender equality, to 1, where one gender performs as poorly as possible across all assessed dimensions. This index reveals outcome-based disparities in reproductive health, empowerment and the labour market. To obtain meaningful log transformations, we multiplied all values of this variable by 100. As this variable lacked values for eight observations, most of them in the case of Serbia, we imputed the missing data using linear interpolation and extrapolation. The second gender gaps variable we tested in our Model 3 (ΔlnGWBLIS) includes the transformation of the Women, Business and the Law Index Score, an indicator that reflects progress towards legal equality between men and women. This variable indicates the extent to which relevant regulations are conducive to women’s economic opportunity and is measured on a 1-100 scale, with higher values suggesting a higher level of opportunities. All model variables are expressed in natural logarithms to stabilise the data and mitigate heteroskedasticity. Table 1 provides a definition of each variable and the data source used to obtain its measurement.
| Variables | Definition and measurement | Source |
|---|---|---|
| GDP | GDP per capita (constant 2015 US$) | WDI database, World Bank |
| OADR | Old-age dependency ratio as % of working-age population (the ratio of people older than 64, to the working age population (15-64)) | WDI database, World Bank |
| OPEN | Trade (% of GDP) | WDI database, World Bank |
| LEB | Life expectancy at birth, total (years) | WDI database, World Bank |
| UNR | Unemployment rate (percent) | WDI database, World Bank |
| UP | Urban population (% of total population) | WDI database, World Bank |
| GII | Gender inequality index (0-1) | United Nations Development Programme |
| WBLIS | Women Business and the Law Index Score (scale 1-100) | World Bank: Women, Business and the Law |
Following Koengkan et al. (2022), Kotschy and Bloom (2023) and Maitra and Ganguli (2024), we opt for the unemployment rate, trade openness, urban population and life expectancy at birth as control variables to account for the broader economic environment. Moreover, these variables are among the most frequently employed in empirical research examining the effects of population ageing and gender inequality on economic growth. Several other variables were considered during our analysis, but were statistically insignificant. As for life expectancy at birth, we believe that it is more relevant for cross-country comparisons and consistent with other control variables being studied. As we emphasize, life expectancy at birth reflects a country’s overall health and living standards rather than solely the health and longevity of the elderly, as is the case with life expectancy at age 65.
We apply the quantile regression method to investigate the distributional and heterogeneous effects across quantiles. This method assesses the impact of independent variables on the dependent variable by considering the conditional distribution at various points. Compared to OLS, this method’s main advantage is that it produces efficient and robust estimates, even when the error term does not strictly adhere to normality assumptions, as stressed by the method’s developers Koenker and Bassett (1978). For instance, the GDP per capita and unemployment rate data often exhibit discrete peaks or heavy tails. This method functions locally at each point in the distribution of the dependent variable and does not depend on assumptions regarding the distribution of the target variable (Barra and Ruggiero 2023). It is worth mentioning that the estimates associated with independent variables vary across different quantiles. The significance of this method becomes particularly evident in situations where the relationship between the conditional means of the two variables is either weak or absent (Binder and Coad 2011). Through its application, we can reveal the distributional and heterogeneous effects of population ageing, gender inequality, and women’s economic empowerment on economic growth across each quantile.
In line with the previous expectations, population ageing is assumed to have an ambiguous effect on economic growth, depending on theoretical arguments and the existing empirical findings. In addition, we hypothesise that an increase in gender gaps in health, empowerment and the labour market has an adverse impact on the economic outlook, whereas enhancing regulations to support women’s economic opportunities promotes economic growth. Other independent variables could produce mixed outcomes.
4 EMPIRICAL RESULTS AND DISCUSSION
According to the descriptive statistics (see Table 2), the average log value of GDP per capita is 9.662, with the maximum of 11.486 and minimum of 7.205, while the standard deviation is 1.036. The mean log value of OADR is 3.19, with the maximum of 3.634 and minimum of 2.524, with a standard deviation of 0.221. The mean log values of OPEN, LEB, UNR and UP are 4.571, 4.345, 2.135 and 4.208, respectively. The average log values of GII and WBLIS are 2.6 and 4.47, with standard deviation values of 0.7 and 0.12, respectively. The logarithmic values of OPEN, UNP, and GII exhibit positive skewness, whereas the remaining variables show negative skewness. Additionally, GII displays leptokurtosis (> 3), while the other variables are platykurtic (< 3).
| Variables | Mean | Median | Std. dev. | Min | Max | Skewness | Kurtosis | N |
|---|---|---|---|---|---|---|---|---|
| lnGDP | 9.662 | 9.798 | 1.036 | 7.205 | 11.486 | -0.369 | 2.127 | 805 |
| lnOADR | 3.19 | 3.216 | 0.221 | 2.524 | 3.634 | -0.487 | 2.741 | 805 |
| lnOPEN | 4.571 | 4.543 | 0.361 | 3.113 | 5.531 | 0.008 | 2.431 | 805 |
| lnLEB | 4.345 | 4.353 | 0.053 | 4.195 | 4.429 | -0.518 | 2.388 | 805 |
| lnUNR | 2.135 | 2.092 | 0.591 | 0.531 | 3.618 | 0.213 | 2.688 | 805 |
| lnUP | 4.208 | 4.226 | 0.195 | 3.731 | 4.586 | -0.384 | 2.574 | 805 |
| lnGII | 2.601 | 2.728 | 0.697 | -0.105 | 3.865 | -0.811 | 3.622 | 805 |
| lnWBLIS | 4.468 | 4.507 | 0.118 | 4.115 | 4.605 | -0.953 | 3.054 | 805 |
Table 3 further provides a correlation matrix for the economic growth regression variables. The correlation of GDP with OADR, LEB, UP and WBLIS is positive, while it is negative for all other variables. We further evaluate multicollinearity by computing the Variance Inflation Factor (VIF) in Table 4. The VIF is a standard measure used to assess multicollinearity, with values above 10 generally indicating that multicollinearity may substantially affect the regression estimates. If we include all variables in a single model, we obtain VIF values that are less than 3 each, demonstrating the lack of their mutual correlation. The VIF is a standard measure used to assess multicollinearity, with values above 10 generally indicating that multicollinearity may substantially affect the regression estimates. If we include all variables in a single model, we obtain VIF values that are less than 3 each, demonstrating the lack of their mutual correlation.
| Variable | GDP | OADR | OPEN | LEB | UNR | UP | GII | WBLIS |
|---|---|---|---|---|---|---|---|---|
| lnGDP | 1.00 | |||||||
| lnOADR | 0.43 | 1.00 | ||||||
| lnOPEN | 0.01 | -0.12 | 1.00 | |||||
| lnLEB | 0.84 | 0.43 | -0.14 | 1.00 | ||||
| lnUNR | -0.51 | -0.21 | -0.22 | -0.22 | 1.00 | |||
| lnUP | 0.68 | 0.52 | -0.02 | 0.52 | -0.38 | 1.00 | ||
| lnGII | -0.70 | -0.44 | -0.09 | -0.67 | 0.43 | -0.56 | 1.00 | |
| lnWBLIS | 0.60 | 0.58 | 0.06 | 0.65 | -0.26 | 0.41 | -0.53 | 1.00 |
| Variables | VIF | 1/VIF |
|---|---|---|
| lnLEB | 2.75 | 0.363106 |
| lnWBLIS | 2.4 | 0.417151 |
| lnGII | 2.3 | 0.433947 |
| lnOADR | 1.86 | 0.537809 |
| lnUP | 1.83 | 0.545587 |
| lnUNR | 1.35 | 0.738767 |
| lnOPEN | 1.22 | 0.818256 |
| Mean VIF | 1.96 |
Table 5 presents the results of the three panel unit root tests to assess the stationarity of our variables. We use Levin-Lin-Chu (LLC), Im-Pesaran-Shin (IPS), and Fisher-ADF tests.2 Each of them assumes the presence of both a constant and a trend. As a rule of thumb for annual data, we employed one lag in our tests. The absence of serial correlation (as will be clear shortly) and the results we obtained for some variables in the case of four lags (results available upon request) suggest a lack of meaningful differences among the results. We tested log-transformed values of our variables of interest, as the values of our choice may possess different stationarity properties than their non-log versions.3
| Variables | Levin-Lin-Chu test | Im-Pesaran-Shin | Fisher-ADF test | |||
|---|---|---|---|---|---|---|
| Level | 1st difference | Level | 1st difference | Level | 1st difference | |
| lnGDP | -3.053*** | -6.983*** | -0.377 | -6.435*** | 69.505 | 196*** |
| lnOADR | -17.11*** | -4.77*** | -13.265*** | 0.55 | 465.478*** | 100.714* |
| lnOPEN | -5.727*** | -8.443*** | -6.418*** | -11.391*** | 196.058*** | 327.569*** |
| lnLEB | 4.585 | -5.597*** | 7.19 | -13.143*** | 28.888 | 438.794*** |
| lnUNR | -5.793*** | -10.061*** | -1.607* | -7.234*** | 111.376*** | 215.119*** |
| lnUP | -1.544* | 4.636 | -1.009 | -7.589*** | 388.479*** | 254.791*** |
| lnGII | -3.693*** | -6.845*** | -0.247 | -6.946*** | 102.079*** | 224.158*** |
| lnWBLIS | -11.115*** | -12.259*** | -1.719** | -12.433*** | 192.011*** | 382.111*** |
| Note: ***, **, and * indicate significant p values at the 1, 5, and 10% levels, respectively. The test used both a constant and a trend, along with one lag value. | ||||||
These findings generally bolster our decision to include growth rates of all variables in our model. According to at least one test, the level values of lnGDP, lnLEB, lnUP, and lnGII exhibit non-stationarity. In contrast, apart from a few exceptions, all variables become stationary after first-differencing. One of them is lnOADR, which, according to the IPS test result, loses stationarity following the application of first-differencing. For this reason, we include the level value of lnOADR in our model. Particularly interesting results arise in the case of lnUP, which shows marginal stationarity of its level value according to the LLC test, which is lost after the first-differences are obtained. In the case of the IPS test, however, the same variable shows non-stationarity in levels, which is eliminated after the first-differencing. Due to the strong stationarity results obtained after first-differencing in the case of the IPS test and our initial decision to focus on growth rates, we decided to stick to the first-differencing value of lnUP in our model.
In order to make our quantile panel regression estimation suitable for any error dependence issues, we test whether any of the three model specifications suffer from heteroskedasticity or correlation issues in their pooled regression versions. As shown in Table 6, Model 3 suffers from mild heteroskedasticity, which is somewhat expected given the heterogeneity of the cross-sections included. On the other hand, serial correlation is entirely absent from our model, as revealed in Table 7. Cross-sectional correlation is, however, present in all three model specifications, as Pesaran’s (2021) test results from Table 7 confirm.
| Test type | Model 1 | Model 2 | Model 3 |
|---|---|---|---|
| Breusch-Pagan/ Cook-Weisberg | 2.31 (0.129) | 1.97 (0.161) | 2.96 (0.085)* |
| Note: ***, **, and * indicate significant p values at the 1, 5 and 10% level, respectively (p-values in parentheses). | |||
| Test type | Model 1 | Model 2 | Model 3 |
|---|---|---|---|
| Wooldridge serial correlation test | 0.338 (0.565) | 0.337 (0.565) | 0.34 (0.564) |
| Pesaran cross-sectional correlation test | 33.18 (0.000)*** | 32.81 (0.000)*** | 30.91 (0.000)*** |
| Note: ***, **, and * indicate significant p values at the 1, 5 and 10% level, respectively (p-values in parentheses). | |||
We treat our sample with the wild bootstrapping method to address the mild heteroskedasticity identified for Model 3 in Table 6. As emphasised by Cameron and Trivedi (2005, 376-7), this form of resampling leads to heteroskedasticity-robust standard errors by enforcing their weighted transformation. Our bootstrapping procedure consisted of 1000 repetitions. We hoped that wild bootstrapping would also help us eliminate the identified cross-sectional correlation from our model, but neither that nor any other step we took managed to do it effectively.4
In applying our model, we first obtain parameter estimates from the quantile regression of the model that excludes gender inequality variables (Model 1). Table 8 presents the findings from the quantile estimation, which shows that the effects of our variables on economic performance are heterogeneous. The results are presented for each predictor variable’s 10th to 90th percentile distribution. The estimated coefficient for population ageing is highly significant and negative at all quantiles. We find that a 1% increase in the proportion of older people in the working-age population results in the decrease in GDP per capita growth of 0.03-0.07 percentage points. It is worth mentioning that the challenges posed by ageing populations have a significantly greater impact on economic growth in high-growing European countries. These results coincide with the findings of Pan and Chang (2021), who argue that population ageing tends to hamper economic growth in high-income economies while boosting GDP growth in low-income and lower-middle-income economies. Additionally, our results are also in line with Ye et al. (2021) for China, Yip et al. (2024) for Malaysia and Nguyen et al. (2024) for 7 ASEAN countries.
| Variable | 10th | 20th | 30th | 40th | 50th | 60th | 70th | 80th | 90th |
|---|---|---|---|---|---|---|---|---|---|
| lnOADR | -0.031***(0.011) | -0.036***(0.006) | -0.039***(0.005) | -0.042***(0.005) | -0.048***(0.006) | -0.048***(0.004) | -0.045***(0.006) | -0.058***(0.008) | -0.067***(0.014) |
| ΔlnOPEN | 0.084**(0.038) | 0.101***(0.029) | 0.122***(0.023) | 0.127***(0.022) | 0.143***(0.02) | 0.152***(0.02) | 0.183***(0.027) | 0.197***(0.028) | 0.194***(0.037) |
| ΔlnLEB | 0.626(0.394) | 0.33(0.273) | 0.265(0.261) | 0.201(0.24) | 0.064(0.27) | -0.129(0.254) | -0.435(0.275) | -0.576*(0.323) | -0.553(0.379) |
| ΔlnUNR | -0.164***(0.015) | -0.149***(0.01) | -0.139***(0.011) | -0.131***(0.011) | -0.131***(0.011) | -0.126***(0.011) | -0.114***(0.014) | -0.11***(0.014) | -0.105***(0.024) |
| ΔlnUP | 0.822*(0.464) | 0.788***(0.222) | 0.413(0.26) | 0.553**(0.245) | 0.407**(0.184) | 0.145(0.154) | 0.076(0.241) | -0.003(0.453) | 0.037(0.692) |
| Intercept | 0.084**(0.035) | 0.11***(0.019) | 0.129***(0.017) | 0.142***(0.016) | 0.17***(0.019) | 0.176***(0.013) | 0.174***(0.02) | 0.227***(0.026) | 0.272***(0.046) |
| Note: ***, **, and * indicate significant p values at the 1, 5 and 10% level, respectively. | |||||||||
Negative demographic trends like low fertility rates and mass migration5 result in an older and smaller workforce. The steadily increasing number of retirees and the decreasing number of working-age individuals reduce the tax base. In such circumstances, the rising demand for healthcare services increases healthcare costs. This struggle with a declining workforce may hinder economic growth and result in capital moving to countries with younger population, characterized by more robust labour markets and sustained consumer demand. If these trends continue, the global distribution of economic power may shift, as countries with older populations are becoming less competitive in attracting capital investments and creating new jobs.
The coefficient for trade openness is significant in all quantiles, with the positive sign suggesting that trade fosters economic growth. Such results are confirmed by Koengkan et al. (2022) for 17 countries in the LAC region, Lee and Shin (2019) for 142 countries, and Liang et al. (2023) for 31 regions in China, who claimed that greater trade openness could lead to increased productivity and sustained economic growth. However, the results contradict the findings of Altuzarra et al. (2021) for SSA countries and Maity and Sinha (2021) for India.
The estimated coefficient of life expectancy at birth is positive and nonsignificant from the 10th to 50th quantile. Nevertheless, the coefficient turns negative between the 60th and 90th quantiles, but it is only statistically significant at the 80th quantile (at a 10% significance level). Such results are aligned with Pham and Vo (2021), who revealed that quantile regression estimators indicate a positive relationship between life expectancy and economic growth at the lower tail but a negative effect at the upper end of the distribution.
The effect of the unemployment rate on economic growth is negative and highly statistically significant across all quantiles, with a more substantial impact observed at the lower quantiles. An increase of 1% in the unemployment rate is associated with a reduction in per capita GDP ranging from 0.11 to 0.16. The analysis of coefficients related to urban population shows a positive correlation that is statistically significant from the 10th to the 50th quantiles of the distribution, except for the 30th quantile. The coefficients at the higher quantiles lose statistical significance, even turning out negative at the 80th quantile. Overall, we find that a higher share of urban residents in the total population is associated with higher economic growth: a 1% increase in the urban population correlates with an expected rise in economic growth of between 0.41% and 0.82%. Moreover, we reveal a decreasing trend regarding the coefficients of urbanisation as we progress to higher quantiles.
In Table 9, we present the quantile estimation results after inclusion of the gender inequality index in the model, whose coefficients align with theoretical expectations. The coefficients for our independent variables show little variation from those in the previous table in terms of sign, magnitude or significance, allowing us to conclude that our panel quantile model is robust. We find a negative effect of gender inequality on economic performance in nearly all quantiles, although its statistical significance varies, which aligns with our initial assumption H2. The coefficient of gender inequality is negative and significant in almost all quantile levels except the 10th and 90th quantile (but highly significant on the 60th and 70th quantile): a 1% increase in gender imbalances results in a decrease in economic growth by 0,002-0,005%. It should be emphasised that this effect becomes more pronounced at the middle and higher quantiles. While the statistically significant effect is small in magnitude, it could still have important implications for promoting inclusive and sustainable growth in the long run. These coefficients’ signs and statistical significance suggest that high-income European countries experience a stronger role of full economic participation and equality.
| Variable | 10th | 20th | 30th | 40th | 50th | 60th | 70th | 80th | 90th |
|---|---|---|---|---|---|---|---|---|---|
| lnOADR |
-0.031*** (0.011) |
-0.04*** (0.006) |
-0.041*** (0.005) |
-0.04*** (0.005) |
-0.044*** (0.005) |
-0.043*** (0.004) |
-0.043*** (0.006) |
-0.051*** (0.008) |
-0.07*** (0.015) |
| ΔlnOPEN |
0.099*** (0.038) |
0.108*** (0.029) |
0.122*** (0.024) |
0.121*** (0.024) |
0.141*** (0.021) |
0.155*** (0.02) |
0.164*** (0.022) |
0.195*** (0.028) |
0.208*** (0.036) |
| ΔlnLEB |
0.595 (0.388) |
0.217 (0.271) |
0.265 (0.266) |
0.164 (0.239) |
0.009 (0.263) |
-0.256 (0.242) |
-0.363 (0.269) |
-0.624* (0.322) |
-0.576 (0.394) |
| ΔlnUNR |
-0.162*** (0.014) |
-0.151*** (0.009) |
-0.144*** (0.011) |
-0.133*** (0.011) |
-0.131*** (0.01) |
-0.128*** (0.009) |
-0.117*** (0.014) |
-0.109*** (0.013) |
-0.101*** (0.021) |
| ΔlnUP |
0.75* (0.444) |
0.667*** (0.233) |
0.529** (0.265) |
0.495** (0.227) |
0.439** (0.175) |
0.167 (0.154) |
0.213 (0.248) |
-0.142 (0.412) |
0.184 (0.709) |
| ΔlnGII |
0.001 (0.002) |
-0.002* (0.001) |
-0.002 (0.001) |
-0.003** (0.001) |
-0.003** (0.001) |
-0.005*** (0.001) |
-0.004*** (0.001) |
-0.004** (0.002) |
-0.003 (0.002) |
| Intercept |
0.084** (0.036) |
0.125*** (0.02) |
0.133*** (0.016) |
0.137*** (0.015) |
0.153*** (0.017) |
0.159*** (0.015) |
0.163*** (0.02) |
0.202*** (0.028) |
0.281*** (0.05) |
| Note: ***, **, and * indicate significant p values at the 1, 5 and 10% level, respectively. | |||||||||
Deterioration in gender equality poses a significant threat to economic growth and political stability, as it not only hampers productivity and innovation, but also fuels social dissatisfaction and activism among those advocating for women’s rights. Therefore, greater gender inequality, expressed in women’s lower levels of empowerment, worse reproductive health, and less participation in the workforce compared to men, is more apparent and has a negative impact on overall economic performance in these countries. This result is similar to that obtained by Bertay et al. (2025), who show that gender inequality negatively impacts economic growth by limiting the utilisation of women’s labour potential. They stress that industries with more female workers tend to grow more rapidly in countries with greater gender equality. We argue that the negative consequences of gender inequality on the economic outlook can be overcome by implementing policies that close the gender pay gap, promote equal pay for equal work (including leadership roles in both public and private sectors), encourage female entrepreneurship, and provide equal opportunities for education and skill development. These findings are similar to Girón and Kazemikhasragh (2022) for 34 Asian and African countries, Koengkan et al. (2022) for 17 countries in LAC region and Algül (2024) for 73 countries.
As can be seen from Table 10, variables generally exhibit behaviour patterns similar to those from earlier model specification estimates. Worth noting is the behaviour of the second gender-related variable, WBLIS. It can be observed that this variable has a positive and relatively consistent effect on economic growth (confirming hypothesis H3), especially in lower-income European countries (the 20th and 30th quantile levels – both significant at the 1% level), with the impact slightly weakening, or becoming less significant in middle-income countries (the 60th quantile). We find that a 1% decrease in gender inequality measured by Women, Business and Law Index is associated with the 0.08-0.16% increase in economic growth. Our findings show that the impact of enhancing women’s rights to access and own property, open businesses, or enter into contracts is the most apparent in lower-income and wealthier European countries but somewhat weaker or insignificant in middle-income European countries. We argue that legal reforms towards gender equality are better implemented in wealthier European countries and represent more transformative change in lower-income ones. In contrast, middle-income European countries face persistent structural or social barriers limiting legal enforcement.
| Variable | 10th | 20th | 30th | 40th | 50th | 60th | 70th | 80th | 90th |
|---|---|---|---|---|---|---|---|---|---|
| lnOADR | -0.034*** (0.01) | -0.035*** (0.006) | -0.039*** (0.005) | -0.04*** (0.004) | -0.043*** (0.005) | -0.048*** (0.005) | -0.044*** (0.006) | -0.055*** (0.009) | -0.065*** (0.014) |
| ΔlnOPEN | 0.117*** (0.04) | 0.105*** (0.028) | 0.12*** (0.022) | 0.124*** (0.02) | 0.14*** (0.018) | 0.155*** (0.02) | 0.182*** (0.028) | 0.176*** (0.027) | 0.198*** (0.035) |
| ΔlnLEB | 0.604 (0.376) | 0.263 (0.282) | 0.062 (0.259) | 0.191 (0.237) | 0.032 (0.272) | -0.226 (0.248) | -0.434 (0.267) | -0.513 (0.328) | -0.501 (0.377) |
| ΔlnUNR | -0.155*** (0.014) | -0.147*** (0.01) | -0.142*** (0.011) | -0.129*** (0.01) | -0.128*** (0.011) | -0.129*** (0.011) | -0.118*** (0.013) | -0.114*** (0.012) | -0.107*** (0.021) |
| ΔlnUP | 0.663* (0.394) | 0.666*** (0.226) | 0.513** (0.238) | 0.53** (0.233) | 0.463** (0.175) | 0.153 (0.166) | 0.077 (0.225) | 0.434 (0.479) | 0.099 (0.657) |
| ΔlnWBLIS | 0.156** (0.07) | 0.107*** (0.027) | 0.072*** (0.026) | 0.086** (0.034) | 0.092** (0.038) | 0.075 (0.058) | 0.152** (0.069) | 0.158** (0.066) | 0.11* (0.062) |
| Intercept | 0.09*** (0.032) | 0.109*** (0.018) | 0.129*** (0.017) | 0.138*** (0.015) | 0.151*** (0.018) | 0.175*** (0.016) | 0.171*** (0.018) | 0.212*** (0.029) | 0.265*** (0.046) |
| Note: ***, **, and * indicate significant p values at the 1, 5 and 10% level, respectively. | |||||||||
By comparing the coefficients of the gender-related variables, it is evident that the impact of WBLIS is significantly greater than that of GII. Such a stronger impact can be explained by the fact that WBLIS measures the economic impact of laws, regulations, and policies on women’s prospects as employees and entrepreneurs, which is more directly aligned with the mechanisms that influence economic growth. On the other hand, GII is a much broader index, which includes gender inequality in health, empowerment and labour market, suggesting that it may have more indirect or delayed impact on economic growth.
5 CONCLUSIONS AND POLICY IMPLICATIONS
We used the quantile regression technique to evaluate how population ageing and gender inequality impacted economic growth in 35 European countries from 2000 to 2022. Our empirical findings have revealed that population ageing harms economic growth. The estimated coefficients for the old-age dependency ratio are highly significant and negative across all quantiles. However, we observe that the magnitude of the coefficients tends to be larger at higher quantiles (in the upper tail of the conditional distribution of economic growth). Thus, we confirm that population ageing hinders economic growth in European countries, likely due to the falling labour force participation rate and rising healthcare and pension costs.
Additionally, we found that trade openness and unemployment rate are key growth determinants. At the same time, an increase in life expectancy at birth positively impacts economic performance only in countries with low and middle incomes. The results of our study show that an increase in gender imbalances harms economic performance, most noticeably in the middle and higher quantiles. It is crucial to highlight that while the magnitude of this effect is relatively minor, even this small impact could be meaningful in promoting inclusive growth in the long run. These findings suggest that the discrimination and exclusion of women from key economic roles have a more significant negative impact on overall economic performance in high-income European countries. Gender-based legal restrictions on economic engagement entail significant economic costs in these societies, where human capital, innovation, and inclusive institutions are crucial for economic growth. We also found that a supportive legal environment for women’s participation in business and the economy is positively and significantly associated with economic growth in low- and high-income European countries.
The study’s results can guide essential policy recommendations for European countries facing significant demographic challenges, particularly population ageing. The adverse effects of an ageing population on economic growth can be mitigated, or even transformed into positive outcomes by encouraging greater participation of older individuals in the workforce. Such an aim should be supported by policies encompassing flexible retirement and later retirement incentives, as well as health and skills initiatives that help extend adult productivity throughout their working lives—initiatives for lifelong learning, active ageing policies, adult reskilling, etc. Enhancing productivity is one of the most fundamental long-term strategies for addressing the economic challenges of demographic ageing. Boosting productivity through investment in education, science, health, and, more broadly, human capital development, becomes essential for mitigating the rising dependency ratios. Equally important, investing in the education of children and young people is crucial for preparing future generations to be more productive and capable of managing the economic challenges posed by an ageing society. In addition, governments should continue implementing reforms in pension (pension indexation, raising the standard retirement age limit) and tax systems, as well as tailored healthcare and long-term care services to create a sustainable social protection framework and state fiscal stability.
Prioritising women’s economic empowerment, a fundamental objective of the UN 2030 Agenda for sustainable development, would guarantee equal access to and participation in current markets, enable access to financial resources, provide decent employment and voting rights, and ensure involvement in decision-making processes on economic issues at all levels. Strengthening gender equality can increase women’s participation in the labour market, thereby improving the utilisation of a society’s human potential. Moreover, the negative demographic trends could be reversed with the help of policy measures aimed at supporting families with children, such as financial assistance, tax relief, extended parental leave, provision of work-family balance, improving working and living conditions, and supporting youth employment and education initiatives. Special attention should be given to removing barriers for women to enter and remain in business, such as the harmful patterns of functioning arising from their subordinate position in the society and stereotypical role division. In addition to the legislative and strategic framework for achieving gender equality, the exchange of experiences, learning, non-financial support, and measures that balance family and professional life are crucial for launching new and innovative programs to support women’s economic initiatives and entrepreneurship. Since population ageing and gender inequalities are closely linked phenomena, policymakers should formulate harmonized and inclusive policies to eliminate or reduce their negative consequences.
Besides the previously mentioned measures, immigration is crucial for mitigating the economic consequences of demographic ageing, particularly by replenishing the labour force, sustaining productivity, and maintaining the demographic balance in many highly developed European countries. In this regard, the forward-looking immigration policy aimed at improving the economic integration of immigrants into labour markets should be an integral part of a broader demographic and labour market strategy to ensure sustainable and inclusive economic growth.
Our study examines the effects of the old-age dependency ratio and gender inequality on economic outlook, while deliberately excluding an analysis of other factors that could influence economic growth, such as the variables of institutional quality, gross savings or health expenditures. Consequently, the possible limitation of this research is the lack of consideration for these additional variables, which presents, at the same time, an opportunity for further exploration in future studies.
This paper was written as part of the 2025 Research Program of the Institute of Social Sciences with the support of the Ministry of Science, Technological Development and Innovation of the Republic of Serbia.
Data availability statement
Data are available from the authors upon request.
References
- Acemoglu, D., & Restrepo, P. (2022). Demographics and Automation. The Review of Economic Studies, 89(1), 1–44. https://doi.org/10.1093/restud/rdab031
- Akinwande, T.S., Turuc, F., Seraj, M., & Ozdeser, H. (2024). The link between gender inequality, financial development, and economic growth in Nigeria: A spectral Granger causality approach. Sustainable Development, 1–11. https://doi.org/10.1002/sd.3252
- Algül, Y. (2024). Assessing the relationship between broad gender inequality and the gender unemployment gap: insights from an extensive global macroeconometric panel analysis. Discover Sustainability, 5, 422. https://doi.org/10.1007/s43621-024-00663-y
- Altuzarra, A., Gálvez-Gálvez, C., & González-Flores, A. (2021). Is Gender Inequality a Barrier to Economic Growth? A Panel Data Analysis of Developing Countries. Sustainability, 13(1), 367. https://doi.org/10.3390/su13010367
- Barra, C., & Ruggiero, N. (2023). Institutional quality and public spending in Europe: A quantile regression approach. Economics & Politics, 35(3), 949–1019. https://doi.org/10.1111/ecpo.12248
- Bertay, A.C., Dordevic, L., & Sever, C. (2025). Gender inequality and economic growth: Evidence from industry-level data. Empirical Economics, 1–36. https://doi.org/10.1007/s00181-024-02698-6
- Binder, M., & Coad, A. (2011). From Average Joe’s happiness to Miserable Jane and Cheerful John: using quantile regressions to analyze the full subjective well-being distribution. Journal of Economic Behavior & Organization, 79(3), 275–290. https://doi.org/10.1016/j.jebo.2011.02.005
- Box, G.E.P., & Cox, D.R. (1964). An Analysis of Transformations. Journal of the Royal Statistical Society, 26(2), 211–252. https://doi.org/10.1111/j.2517-6161.1964.tb00553.x
- Calvo-Sotomayor, I., Laka, J. P., & Aguado, R. (2019). Workforce Ageing and Labour Productivity in Europe. Sustainability, 11(20), 5851. https://doi.org/10.3390/su11205851
- Cameron, A.C., & Trivedi, P.K. (2005). Microeconometrics: Methods and Applications. New York: Cambridge University Press. https://doi.org/10.1017/CBO9780511811241
- Chen, Q., Chi, Q., Chen, Y., Lyulyov, O., & Pimonenko, T. (2022). Does Population Ageing Impact China’s Economic Growth? International Journal of Environmental Research and Public Health, 19(19), 12171. https://doi.org/10.3390/ijerph191912171
- Cho, D., & Rhee, D-E. (2024). Government debt and fiscal multipliers in the era of population ageing. Macroeconomic Dynamics, 28(5), 1161–1181. https://doi.org/10.1017/S1365100523000421
- Cristea, M., Noja G. G., Dănăcică, D. E., & Ştefea, P. (2020). Population ageing, labour productivity and economic welfare in the European Union, Economic Research-Ekonomska Istraživanja, 33(1), 1354–1376. https://doi.org/10.1080/1331677X.2020.1748507
- Cylus, J., & Al Tayara, L. (2021). Health, an ageing labour force, and the economy: Does health moderate the relationship between population age-structure and economic growth?. Social Science & Medicine, 287, 114353. https://doi.org/10.1016/j.socscimed.2021.114353
- Filipović, S., & Miljković, M. (2024). Impact of population ageing on fiscal balance in the European Union. Stanovnistvo, 62(2), 231–250. https://doi.org/10.59954/stnv.648
- Gao, W., Chen, Y., Xu, S., Lyulyov, O., & Pimonenko, T. (2023). The Role of Population Aging in High-Quality Economic Development: Mediating Role of Technological Innovation. SageOpen, 13(4). https://doi.org/10.1177/21582440231202385
- Girón, A., & Kazemikhasragh, A. (2022). Gender Equality and Economic Growth in Asia and Africa: Empirical Analysis of Developing and Least Developed Countries. Journal of the Knowledge Economy, 13, 1433–1443. https://doi.org/10.1007/s13132-021-00782-1
- Ilić, N. (2022). Gender Pay Gap in the Western Balkans: Why Do Women Earn Less Than Men?. In M. Davinić & S. Kostić (Eds.), Gender Competent Public Law and Policies. Gender Perspectives in Law (pp. 69-90). Springer, Cham. https://doi.org/10.1007/978-3-031-14706-7_4
- Im, K.S., Pesaran, M.H., & Shin, Y. (2003). Testing for unit roots in heterogeneous panels. Journal of Econometrics, 115(1), 53–74. https://doi.org/10.1016/S0304-4076(03)00092-7
- Jayawardhana, T., Jayathilaka, R., Nimnadi, T., Anuththara, S., Karadanaarachchi, R., Galappaththi, K., & Galappaththi, T. (2023). The cost of aging: Economic growth perspectives for Europe. PLoS ONE, 18(6), e0287207. https://doi.org/10.1371/journal.pone.0287207
- Juhásová, S., Buleca, J., Tóth, P., & Mirdala, R. (2023). The Impact of Gender Inequality on GDP in EU Countries. Central European Journal of Public Policy, 17(2), 13–32. https://doi.org/10.2478/cejpp-2023-0011
- Kam, A. J. Y., Oboh, J. S., Othman, Z., & Sufian, J. (2022). The impact of gender inequality on economic growth: an explanatory sequential mixed methods study of female labour participation in the civil service. European Journal of Government and Economics, 11(2), 210–233. https://doi.org/10.17979/ejge.2022.11.2.8951
- Karoui, K., & Feki, R. (2018). The Effect of Gender Inequality on Economic Development: Case of African Countries. Journal of the Knowledge Economy, 9, 294–300. https://doi.org/10.1007/s13132-015-0341-9
- Koengkan, M., Fuinhas, J.A., Belucio, M., Kazemzadeh, E., Poveda, Y.E.M., Alavijeh, N.K., & Santiago, R. (2022). The Consequences of Gender Inequality on Latin America’s Economic Growth: Macroeconomic Evidence. Sexes, 3(3), 396–412. https://doi.org/10.3390/sexes3030030
- Koenker, R., & Bassett, G. (1978). Regression Quantiles. Econometrica, 46(1), 33–50. https://doi.org/10.2307/1913643
- Kotschy, R., & Bloom, D.E. (2023). Population ageing and economic growth: From demographic dividend to demographic drag?. Cambridge: National Bureau for Economic Research (NBER Working Paper No. 31585). https://www.nber.org/system/files/working_papers/w31585/w31585.pdf
- Lee, H.H., & Shin, K. (2019). Nonlinear effects of population ageing on economic growth. Japan and the World Economy, 51, 100963. https://doi.org/10.1016/j.japwor.2019.100963
- Lee, H.H., & Shin, K. (2021). Decomposing effects of population ageing on economic growth in OECD countries. Asian Economic Papers, 20(3), 138–159. https://doi.org/10.1162/asep_a_00839
- Lee, J.W. & Song, E. (2020). Aging Labor, ICT Capital, and Productivity in Japan and Korea. Journal of the Japanese and International Economies, 58, 101095. https://doi.org/10.2139/ssrn.3518875
- Levin, A., Lin C.F., & Chu, C. (2002). Unit root tests in panel data: asymptotic and finite sample properties. Journal of Econometrics, 108(1), 1–24. https://doi.org/10.1016/S0304-4076(01)00098-7
- Liang, Y., Mazlan, N.S., Mohamed, A.B., Mhd Bani N.Y.B., & Liang, B. (2023). Regional impact of aging population on economic development in China: Evidence from panel threshold regression (PTR). PLoS ONE, 18(3), e0282913. https://doi.org/ 10.1371/journal.pone.0282913
- Lindh, T. & Malmberg, B. (2009). European Union economic growth and the age structure of the population. Economic Change and Restructuring, 42, 159–187. https://doi.org/10.1007/s10644-008-9057-1
- Maddala, G.S., & Wu, S. (1999). A Comparative Study of Unit Root Tests with Panel Data and a New Simple Test. Oxford Bulletin of Economics and Statistics, 61(S1), 631–652. https://doi.org/10.1111/1468-0084.0610s1631
- Maestas, N., Mullen, K.J., & Powell, D. (2023). The Effect of Population Ageing on Economic Growth, the Labor Force, and Productivity. American Economic Journal: Macroeconomics, 15(2), 306–332. https://doi.org/ 10.1257/mac.20190196
- Maitra, B., & Ganguli, D. (2024). Impact of fertility decline, gender, and social development on economic growth in India. Journal of Social and Economic Development, 1–22. https://doi.org/10.1007/s40847-024-00345-5
- Maity, S. & Sinha, A. (2021). Linkages between economic growth and population ageing with a knowledge spillover effect. Journal of the Knowledge Economy, 12(4), 1905–1924. https://doi.org/10.1007/s13132-020-00696-4
- Mamun, S.A.K., Rahman, M.M., & Khanam, R. (2020). The relation between an ageing population and economic growth in Bangladesh: Evidence from an endogenous growth model. Economic Analysis and Policy, 66, 14–25. https://doi.org/10.1016/j.eap.2020.02.001
- Matković, G. (2022). Starenje stanovništva, In D. Vuković (ur.), Ljudski razvoj kao odgovor na demografske promene (pp. 164-177). https://hdr.undp.org.rs/wp-content/uploads/2023/05/Nacionalni-izvestaj-o-ljudskom-razvoju-Srbija-2022-e1.pdf
- Mihajlović, V., & Miladinov, G. (2024). Impact of population ageing on economic growth in emerging EU countries. Ekonomický časopis/Journal of Economics, 72(1-2), 50–71. https://doi.org/10.31577/ekoncas.2024.01-02.03
- Nam, H. J., Bilgin, M. H., & Ryu, D. (2024). Do Financial Liberalization and Gender Inequality Moderate Trade Liberalization’s Impact on Growth in European Transition Economies?. Eastern European Economics, 1–16. https://doi.org/10.1080/00128775.2024.2415928
- Nam, H. J., Ryu, D., & Szilagyi, P. G. (2025). Gender inequality, institutional quality and economic outcomes in the European Union. European Financial Management, 31(1), 463–492. https://doi.org/10.1111/eufm.12508
- Ngepah, N., Saba, C.S., & Tinga, C.L. (2024). Gender inequality and economic growth in developing countries. International Economics/Economia Internazionale, 77(3), 371–416. https://ideas.repec.org/a/ris/ecoint/0976.html
- Nguyen, T.T., Nguyen, T.D., & Pham, T.L. (2024). Population ageing and economic growth: evidence from ASEAN countries. Cogent Business & Management, 11(1), 1–16, https://doi.org/10.1080/23311975.2023.2298055
- Nicolini, R., & Roig, J. L. (2024). The spatial dimension of ageing and growth in European regions. The Annals of Regional Science, 73, 1649–1679. https://doi.org/10.1007/s00168-024-01311-z
- Pais-Magalhães, V., Moutinho, V., & Robaina, M. (2022). Is an ageing population impacting energy use in the European Union? Drivers, lifestyles, and consumption patterns of elderly households. Energy Research & Social Science, 85, 102443. https://doi.org/10.1016/j.erss.2021.102443
- Pan, J. N., & Chang, M. L. (2021). Population ageing, middle-income trap, and economic growth: an empirical study of Asian economies. The Singapore Economic Review, 66(6), 1577–1594. https://doi.org/10.1142/S0217590818420092
- Papapetrou, E., & Tsalaporta, P. (2020). The impact of population ageing in rich countries: What’s the future?. Journal of Policy Modeling, 42(1), 77–95. https://doi.org/10.1016/j.jpolmod.2019.12.002
- Park, D., & Shin, K. (2023). Population Ageing, Silver Dividend, and Economic Growth. Mandaluyong: Asian Development Bank (Asian Development Bank Economics Working Paper Series 678). https://www.adb.org/sites/default/files/publication/864241/ewp-678-population-aging-silver-dividend-economic-growth.pdf
- Pesaran, M.H. (2021). General Diagnostic Tests for Cross Section Dependence in Panels. Empirical Economics, 60(1), 13–50. https://doi.org/10.1007/s00181-020-01875-7
- Pham, T. N., & Vo, D. H. (2021). Ageing population and economic growth in developing countries: a quantile regression approach. Emerging Markets Finance and Trade, 57(1), 108–122. https://doi.org/10.1080/1540496X.2019.1698418
- Rivic, S. (2023). Costs of gender inequality-An economic analyis. Technische Universität Wien. https://doi.org/10.34726/hss.2023.115680
- Roblek, V., Mesko, M., Dimovski, V., & Peterlin, J. (2019). Smart technologies as social innovation and complex social issues of the Z generation. Kybernetes, 48(1), 91-107. https://doi.org/10.1108/K-09-2017-0356
- Seok, J. H., & Kim, S.-E. (2024). The impact of population ageing on economic growth in Korea: Revisiting the export-led growth hypothesis framework. Journal of International Trade & Economic Development, 33(6), 1091–1107. https://doi.org/10.1080/09638199.2023.2235434
- Temsumrit, N. (2023). Can ageing population affect economic growth through the channel of government spending?. Heliyon, 9(9), e19521. https://doi.org/10.1016/j.heliyon.2023.e19521
- United Nations. (2024). Global Issues: Ageing. https://www.un.org/en/global-issues/ageing
- WHO (2022, October 7). Ageing and health. World Health Organization. https://www.knowledge-action-portal.com/en/content/ageing-and-health
- Williams, G.A., Cylus, J., Al Tayara, L., Roubal, T., Tsilaajav, T., & Barber, S.L. (2022). Can healthy ageing moderate the effects of population ageing on economic growth and health spending trends in Mongolia? A modelling study. Health Research Policy and Systems, 20(1), 122. https://doi.org/10.1186/s12961-022-00916-0
- World Bank. (2024). The World Bank in Gender. https://www.worldbank.org/en/topic/gender/overview#1
- Ye, J., Chen, Z., & Peng, B. (2021). Is the demographic dividend diminishing in China? Evidence from population aging and economic growth during 1990–2015. Review of Development Economics, 25(4), 2255–2274. https://doi.org/10.1111/rode.12794
- Yip, T.-M., Lai, S.-L., & Lau, W.-Y. (2024). An Empirical Analysis of the Relationship between Economic Growth and Population Aging in Malaysia. Singapore Economic Review, 1–22. https://doi.org/10.1142/S0217590823500601
Footnotes
- Albania, Belarus, Belgium, Bulgaria, Bosnia and Herzegovina, Croatia, Cyprus, Czech Republic, Denmark, Estonia, Finland, France, Georgia, Germany, Greece, Hungary, Ireland, Italy, Latvia, Lithuania, Moldova, North Macedonia, Netherlands, Norway, Poland, Portugal, Romania, Serbia, Slovakia, Slovenia, Spain, Sweden, Ukraine and the United Kingdom.
- The Fisher-ADF test is based on the inverse χ2 distribution, while other tests include an assumption of normality. All of them were performed using the Bartlett kernel. More on LLC can be found in the paper of Levin et al. (2002). Specifics about the IPS test can be gleaned from Im et al. (2003), while an explanation of the Fisher-ADF test is contained in the work of Maddala and Wu (1999).
- A seminal paper by Box and Cox (1964) provides more discussion on transformation options that can potentially improve stationarity.
- Besides wild bootstrapping, we tried excluding some variables from the model and adding others (including various country and time dummies). Even though we are left to try some other approaches (such as factor-augmented quantile regression), the results we obtained for the mean-based generalised least squares regression of our model indicate that the presence of cross-sectional correlation, unlike heteroskedasticity which affects the statistical significance of the effect of urban population, does not significantly alter any property of our parameter estimates (the results are available upon request).
- Albania, Bosnia and Herzegovina, Croatia, Serbia, North Macedonia, Bulgaria, Moldova, Ukraine, and Romania are particularly impacted by the emigration of young people.
Article Details
Published by the Institute of Social Sciences - Center for Demographic Research




References
Acemoglu, D., & Restrepo, P. (2022). Demographics and Automation. The Review of Economic Studies, 89(1), 1–44. https://doi.org/10.1093/restud/rdab031
Akinwande, T.S., Turuc, F., Seraj, M., & Ozdeser, H. (2024). The link between gender inequality, financial development, and economic growth in Nigeria: A spectral Granger causality approach. Sustainable Development, 1–11. https://doi.org/10.1002/sd.3252
Algül, Y. (2024). Assessing the relationship between broad gender inequality and the gender unemployment gap: insights from an extensive global macroeconometric panel analysis. Discover Sustainability, 5, 422. https://doi.org/10.1007/s43621-024-00663-y
Altuzarra, A., Gálvez-Gálvez, C., & González-Flores, A. (2021). Is Gender Inequality a Barrier to Economic Growth? A Panel Data Analysis of Developing Countries. Sustainability, 13(1), 367. https://doi.org/10.3390/su13010367
Barra, C., & Ruggiero, N. (2023). Institutional quality and public spending in Europe: A quantile regression approach. Economics & Politics, 35(3), 949–1019. https://doi.org/10.1111/ecpo.12248
Bertay, A.C., Dordevic, L., & Sever, C. (2025). Gender inequality and economic growth: Evidence from industry-level data. Empirical Economics, 1–36. https://doi.org/10.1007/s00181-024-02698-6
Binder, M., & Coad, A. (2011). From Average Joe’s happiness to Miserable Jane and Cheerful John: using quantile regressions to analyze the full subjective well-being distribution. Journal of Economic Behavior & Organization, 79(3), 275–290. https://doi.org/10.1016/j.jebo.2011.02.005
Box, G.E.P., & Cox, D.R. (1964). An Analysis of Transformations. Journal of the Royal Statistical Society, 26(2), 211–252. https://doi.org/10.1111/j.2517-6161.1964.tb00553.x
Calvo-Sotomayor, I., Laka, J. P., & Aguado, R. (2019). Workforce Ageing and Labour Productivity in Europe. Sustainability, 11(20), 5851. https://doi.org/10.3390/su11205851
Cameron, A.C., & Trivedi, P.K. (2005). Microeconometrics: Methods and Applications. New York: Cambridge University Press. https://doi.org/10.1017/CBO9780511811241
Chen, Q., Chi, Q., Chen, Y., Lyulyov, O., & Pimonenko, T. (2022). Does Population Ageing Impact China’s Economic Growth? International Journal of Environmental Research and Public Health, 19(19), 12171. https://doi.org/10.3390/ijerph191912171
Cho, D., & Rhee, D-E. (2024). Government debt and fiscal multipliers in the era of population ageing. Macroeconomic Dynamics, 28(5), 1161–1181. https://doi.org/10.1017/S1365100523000421
Cristea, M., Noja G. G., Dănăcică, D. E., & Ştefea, P. (2020). Population ageing, labour productivity and economic welfare in the European Union, Economic Research-Ekonomska Istraživanja, 33(1), 1354–1376. https://doi.org/10.1080/1331677X.2020.1748507
Cylus, J., & Al Tayara, L. (2021). Health, an ageing labour force, and the economy: Does health moderate the relationship between population age-structure and economic growth?. Social Science & Medicine, 287, 114353. https://doi.org/10.1016/j.socscimed.2021.114353
Filipović, S., & Miljković, M. (2024). Impact of population ageing on fiscal balance in the European Union. Stanovnistvo, 62(2), 231–250. https://doi.org/10.59954/stnv.648
Gao, W., Chen, Y., Xu, S., Lyulyov, O., & Pimonenko, T. (2023). The Role of Population Aging in High-Quality Economic Development: Mediating Role of Technological Innovation. SageOpen, 13(4). https://doi.org/10.1177/21582440231202385
Girón, A., & Kazemikhasragh, A. (2022). Gender Equality and Economic Growth in Asia and Africa: Empirical Analysis of Developing and Least Developed Countries. Journal of the Knowledge Economy, 13, 1433–1443. https://doi.org/10.1007/s13132-021-00782-1
Ilić, N. (2022). Gender Pay Gap in the Western Balkans: Why Do Women Earn Less Than Men?. In M. Davinić & S. Kostić (Eds.), Gender Competent Public Law and Policies. Gender Perspectives in Law (pp. 69-90). Springer, Cham. https://doi.org/10.1007/978-3-031-14706-7_4
Im, K.S., Pesaran, M.H., & Shin, Y. (2003). Testing for unit roots in heterogeneous panels. Journal of Econometrics, 115(1), 53–74. https://doi.org/10.1016/S0304-4076(03)00092-7
Jayawardhana, T., Jayathilaka, R., Nimnadi, T., Anuththara, S., Karadanaarachchi, R., Galappaththi, K., & Galappaththi, T. (2023). The cost of aging: Economic growth perspectives for Europe. PLoS ONE, 18(6), e0287207. https://doi.org/10.1371/journal.pone.0287207
Juhásová, S., Buleca, J., Tóth, P., & Mirdala, R. (2023). The Impact of Gender Inequality on GDP in EU Countries. Central European Journal of Public Policy, 17(2), 13–32. https://doi.org/10.2478/cejpp-2023-0011
Kam, A. J. Y., Oboh, J. S., Othman, Z., & Sufian, J. (2022). The impact of gender inequality on economic growth: an explanatory sequential mixed methods study of female labour participation in the civil service. European Journal of Government and Economics, 11(2), 210–233. https://doi.org/10.17979/ejge.2022.11.2.8951
Karoui, K., & Feki, R. (2018). The Effect of Gender Inequality on Economic Development: Case of African Countries. Journal of the Knowledge Economy, 9, 294–300. https://doi.org/10.1007/s13132-015-0341-9
Koengkan, M., Fuinhas, J.A., Belucio, M., Kazemzadeh, E., Poveda, Y.E.M., Alavijeh, N.K., & Santiago, R. (2022). The Consequences of Gender Inequality on Latin America’s Economic Growth: Macroeconomic Evidence. Sexes, 3(3), 396–412. https://doi.org/10.3390/sexes3030030
Koenker, R., & Bassett, G. (1978). Regression Quantiles. Econometrica, 46(1), 33–50. https://doi.org/10.2307/1913643
Kotschy, R., & Bloom, D.E. (2023). Population ageing and economic growth: From demographic dividend to demographic drag?. Cambridge: National Bureau for Economic Research (NBER Working Paper No. 31585). https://www.nber.org/system/files/working_papers/w31585/w31585.pdf
Lee, H.H., & Shin, K. (2019). Nonlinear effects of population ageing on economic growth. Japan and the World Economy, 51, 100963. https://doi.org/10.1016/j.japwor.2019.100963
Lee, H.H., & Shin, K. (2021). Decomposing effects of population ageing on economic growth in OECD countries. Asian Economic Papers, 20(3), 138–159. https://doi.org/10.1162/asep_a_00839
Lee, J.W. & Song, E. (2020). Aging Labor, ICT Capital, and Productivity in Japan and Korea. Journal of the Japanese and International Economies, 58, 101095. https://doi.org/10.2139/ssrn.3518875.
Levin, A., Lin C.F., & Chu, C. (2002). Unit root tests in panel data: asymptotic and finite sample properties. Journal of Econometrics, 108(1), 1–24. https://doi.org/10.1016/S0304-4076(01)00098-7
Liang, Y., Mazlan, N.S., Mohamed, A.B., Mhd Bani N.Y.B., & Liang, B. (2023). Regional impact of aging population on economic development in China: Evidence from panel threshold regression (PTR). PLoS ONE, 18(3), e0282913. https://doi.org/ 10.1371/journal.pone.0282913
Lindh, T. & Malmberg, B. (2009). European Union economic growth and the age structure of the population. Economic Change and Restructuring, 42, 159–-187. https://doi.org/10.1007/s10644-008-9057-1
Maddala, G.S., & Wu, S. (1999). A Comparative Study of Unit Root Tests with Panel Data and a New Simple Test. Oxford Bulletin of Economics and Statistics, 61(S1), 631–652. https://doi.org/10.1111/1468-0084.0610s1631
Maestas, N., Mullen, K.J., & Powell, D. (2023). The Effect of Population Ageing on Economic Growth, the Labor Force, and Productivity. American Economic Journal: Macroeconomics, 15(2), 306–332. https://doi.org/ 10.1257/mac.20190196
Maitra, B., & Ganguli, D. (2024). Impact of fertility decline, gender, and social development on economic growth in India. Journal of Social and Economic Development, 1–22. https://doi.org/10.1007/s40847-024-00345-5
Maity, S. & Sinha, A. (2021). Linkages between economic growth and population ageing with a knowledge spillover effect. Journal of the Knowledge Economy, 12(4), 1905–1924. https://doi.org/10.1007/s13132-020-00696-4
Mamun, S.A.K., Rahman, M.M., & Khanam, R. (2020). The relation between an ageing population and economic growth in Bangladesh: Evidence from an endogenous growth model. Economic Analysis and Policy, 66, 14–25. https://doi.org/10.1016/j.eap.2020.02.001
Matković, G. (2022). Starenje stanovništva, In D. Vuković (ur.), Ljudski razvoj kao odgovor na demografske promene (pp. 164-177). https://hdr.undp.org.rs/wp-content/uploads/2023/05/Nacionalni-izvestaj-o-ljudskom-razvoju-Srbija-2022-e1.pdf
Mihajlović, V., & Miladinov, G. (2024). Impact of population ageing on economic growth in emerging EU countries. Ekonomický časopis/Journal of Economics, 72(1-2), 50–71. https://doi.org/10.31577/ekoncas.2024.01-02.03
Nam, H. J., Bilgin, M. H., & Ryu, D. (2024). Do Financial Liberalization and Gender Inequality Moderate Trade Liberalization’s Impact on Growth in European Transition Economies?. Eastern European Economics, 1–-16. https://doi.org/10.1080/00128775.2024.2415928
Nam, H. J., Ryu, D., & Szilagyi, P. G. (2025). Gender inequality, institutional quality and economic outcomes in the European Union. European Financial Management, 31(1), 463–-492. https://doi.org/10.1111/eufm.12508
Ngepah, N., Saba, C.S., & Tinga, C.L. (2024). Gender inequality and economic growth in developing countries. International Economics/Economia Internazionale, 77(3), 371–416. https://ideas.repec.org/a/ris/ecoint/0976.html
Nguyen, T.T., Nguyen, T.D., & Pham, T.L. (2024). Population ageing and economic growth: evidence from ASEAN countries. Cogent Business & Management, 11(1), 1–16, https://doi.org/10.1080/23311975.2023.2298055
Nicolini, R., & Roig, J. L. (2024). The spatial dimension of ageing and growth in European regions. The Annals of Regional Science, 73, 1649–-1679. https://doi.org/10.1007/s00168-024-01311-z
Pais-Magalhães, V., Moutinho, V., & Robaina, M. (2022). Is an ageing population impacting energy use in the European Union? Drivers, lifestyles, and consumption patterns of elderly households. Energy Research & Social Science, 85, 102443. https://doi.org/10.1016/j.erss.2021.102443
Pan, J. N., & Chang, M. L. (2021). Population ageing, middle-income trap, and economic growth: an empirical study of Asian economies. The Singapore Economic Review, 66(6), 1577–1594. https://doi.org/10.1142/S0217590818420092
Papapetrou, E., & Tsalaporta, P. (2020). The impact of population ageing in rich countries: What’s the future?. Journal of Policy Modeling, 42(1), 77–95. https://doi.org/10.1016/j.jpolmod.2019.12.002
Park, D., & Shin, K. (2023). Population Ageing, Silver Dividend, and Economic Growth. Mandaluyong: Asian Development Bank (Asian Development Bank Economics Working Paper Series 678). https://www.adb.org/sites/default/files/publication/864241/ewp-678-population-aging-silver-dividend-economic-growth.pdf
Pesaran, M.H. (2021). General Diagnostic Tests for Cross Section Dependence in Panels. Empirical Economics, 60(1), 13–50. https://doi.org/10.1007/s00181-020-01875-7
Pham, T. N., & Vo, D. H. (2021). Ageing population and economic growth in developing countries: a quantile regression approach. Emerging Markets Finance and Trade, 57(1), 108–122. https://doi.org/10.1080/1540496X.2019.1698418
Rivic, S. (2023). Costs of gender inequality-An economic analyis. Technische Universität Wien. https://doi.org/10.34726/hss.2023.115680
Roblek, V., Mesko, M., Dimovski, V., & Peterlin, J. (2019). Smart technologies as social innovation and complex social issues of the Z generation. Kybernetes, 48(1), 91-107. https://doi.org/10.1108/K-09-2017-0356
Seok, J. H., & Kim, S.-E. (2024). The impact of population ageing on economic growth in Korea: Revisiting the export-led growth hypothesis framework. Journal of International Trade & Economic Development, 33(6), 1091–1107. https://doi.org/10.1080/09638199.2023.2235434
Temsumrit, N. (2023). Can ageing population affect economic growth through the channel of government spending?. Heliyon, 9(9), e19521. https://doi.org/10.1016/j.heliyon.2023.e19521
United Nations. (2024). Global Issues: Ageing. https://www.un.org/en/global-issues/ageing
WHO (2022, October 7). Ageing and health. World Health Organization. https://www.knowledge-action-portal.com/en/content/ageing-and-health
Williams, G.A., Cylus, J., Al Tayara, L., Roubal, T., Tsilaajav, T., & Barber, S.L. (2022). Can healthy ageing moderate the effects of population ageing on economic growth and health spending trends in Mongolia? A modelling study. Health Research Policy and Systems, 20(1), 122. https://doi.org/10.1186/s12961-022-00916-0
World Bank. (2024). The World Bank in Gender. https://www.worldbank.org/en/topic/gender/overview#1
Ye, J., Chen, Z., & Peng, B. (2021). Is the demographic dividend diminishing in China? Evidence from population aging and economic growth during 1990–2015. Review of Development Economics, 25(4), 2255–2274. https://doi.org/10.1111/rode.12794
Yip, T.-M., Lai, S.-L., & Lau, W.-Y. (2024). An Empirical Analysis of the Relationship between Economic Growth and Population Aging in Malaysia. Singapore Economic Review, 1–22. https://doi.org/10.1142/S0217590823500601