
National Transfer Accounts and Implications for Social Sector Policies in the Republic of Serbia
Article Sidebar
Main Article Content
Abstract
This paper presents the first comprehensive analysis of the National Transfer Accounts (NTA) findings for Serbia, based on the data from the Statistical Office of the Republic of Serbia (SORS) for 2018. Using the NTA methodology, which integrates survey and administrative data to examine economic flows across age groups, the study highlights critical implications for social sector policy. The analysis employs a comparative approach, contrasting Serbia’s findings with those of EU25 countries using the data from the AGENTA database for 2010. In Serbia, labor income grows later in the life cycle and begins to decline relatively early. The age profile of public and private consumption does not suggest complementarity, nor does it support life-cycle consumption smoothing. Notably, the Serbian context reveals limited “socialization” of spending on early childhood education and elderly healthcare. Serbia’s life-cycle deficit disappears at age 27 and re-emerges at 58, shortening the surplus period to 31 years— noticeably shorter than EU averages. Furthermore, the aggregate deficit for dependent age groups constitutes 58.5% of labor income, significantly exceeding EU25 levels. These findings underscore the need for targeted policy reforms in early childhood education, long-term eldercare, and the pension system to address Serbia’s demographic and economic challenges effectively.
1 INTRODUCTION
The National Transfer Accounts (NTA) constitute a complete, systematic and coherent accounting of economic flows from one age group or generation to another in a given calendar year (UN 2013: vi). During childhood and old age, a portion of an individual’s consumption is not covered by labor income but must instead be supported through private and public transfers or asset-based reallocations.
The key goal of the NTA accounts system is to assess the generational dimension of the economy. According to Lee and Mason (2011: 7), the generational economy consists of: (1) the social institutions and economic mechanisms used by each generation or age group to produce, consume, share, and save resources; (2) the economic flows across generations or age groups that characterize the generational economy; (3) explicit and implicit contracts that govern intergenerational flows; and (4) the intergenerational distribution of income or consumption that results from the foregoing.
The NTA method was established by Lee (1994) and Mason et al. (2009). Since the development and broader acceptance of the NTA method, research on generational economies in various countries, including cross-country differences, has increasingly featured in numerous analyses (Lee and Mason 2011; Lee, S. H. and Ogawa 2011;Mason and Lee 2013; D’Albis and Moosa 2015;Abío et al. 2017;Loichinger et al. 2017;Vanhuysse, Medgyesi and Gál 2023). Analysis for EU countries gained momentum with the project titled Ageing Europe: An application of National Transfer Accounts (NTA) for explaining and projecting trends in public finances (AGENTA), which produced a comprehensive database for 25 out of the 28 member countries of what was then the European Union. Research topics have included, among others, differences in aggregate life-cycle deficits (Hammer, Prskawetz and Freund 2015); asymmetry in the socialization of intergenerational transfers (Gál, Vanhuysse and Vargha 2018); the links between public finances and population changes in age structure (Chłoń-Domińczak et al. 2019); sustainability of the public transfer systems (Hammer et al. 2019); transfers through unpaid household work (Istenič, Hammer and Sambt 2019); the different organization of transfer systems across Europe (Sambt, Hammer and Istenič 2021), etc. The NTA framework is especially valuable for analyzing social security systems, pensions, human capital accumulation and intergenerational equity (Lee and Mason 2011; D’Albis and Moosa 2015). From a policy perspective, research has explored the impact of population ageing on the sustainability and intergenerational fairness of public fiscal policy (Sánchez-Romero et al. 2019); the effects of aging on fiscal budgets (Kluge, Goldstein and Vogt 2019); sustainability of the welfare system (Spielauer et al. 2022); identification of winners and losers in pension reforms (Sánchez-Romero, Schuster and Prskawetz 2023), etc.
The first NTA for Serbia were developed by the Statistical Office of the Republic of Serbia (SORS) in 2021, based on data from 2018. While these findings have not yet been made publicly available, the author had access to them as a part of a project funded by United Nations Population Fund (UNFPA) Serbia. The first detailed analysis based on the data from 2018 was conducted as a part of the UNFPA project (Matković, 2023), while the analysis of the life-cycle account and life-cycle deficit segments was carried out using the data from 2019 (Poljak and Manić, 2024). Based on NTA-based insights, Matković (2023) provides detailed recommendations for social policy.
The main objective of this paper is to present key findings from the 2018 NTA for Serbia and compare them with available data for EU countries, with particular emphasis on insights relevant for social sector policies. The conclusions also highlight the policy implications of the NTA analysis for Serbia, specifically regarding preschool education, long-term care and pensions. The analysis of the 2018 Serbian and 2010 EU25 NTA data is still relevant today, as it reflects enduring structural trends in intergenerational economic flows, as well as demographic challenges that require long-term solutions to address and evolve.
The central research questions for this paper are:
1. How do the age profiles of labor income, consumption, and life-cycle deficits in Serbia differ from those in the EU25 countries, and what are the implications for intergenerational economic sustainability?
2. To what extent do the current social sector policies in Serbia, particularly in preschool education, elder healthcare, and pensions, address the challenges revealed by the National Transfer Accounts analysis?
By addressing these questions, this research contributes to broader understanding of economic sustainability in Serbia and provides a foundation for policy recommendations aimed at enhancing the resilience of Serbia’s social sector in the face of demographic and economic challenges.
2 METHOD AND DATA
The NTA builds upon the System of National Accounts (SNA) data by incorporating the age dimension, thereby enhancing understanding of the generational economy. The distribution of aggregate values across age groups is estimated using survey and administrative data. This section of the paper provides only basic information about the NTA variables. For comprehensive methodological insights, the UN NTA manual (UN 2013) and the European NTA manual (Istenič et al. 2016) offer detailed information.
The National Transfer Accounts are divided into three sub-accounts: life cycle account; transfer account and asset-based reallocations account.
1. Life cycle account consist of labor income, consumption, and the life cycle deficit.
Labor income includes earnings, contributions paid by the employer, and self-employment income (Istenič et al. 2016: 16;UN 2013: 93).
Consumption is divided into public and private, and additionally into consumption on education, health, and other consumption (public administration, defense, public lighting, justice, etc.) (UN 2013: 91;Istenič et al. 2016: 15). The age profile of public consumption is primarily shaped by spending on education and health, as public consumption for other purposes is distributed equally across all age groups (UN 2013: 103;Istenič et al. 2016: 37). In contrast, private consumption is mainly driven by other expenditures; however, the paper focus specifically on the age distribution of private consumption on education and healthcare, considering their importance to social sector policies.
Life-cycle deficit shows the difference between consumption and labor income for a given age (Istenič et al. 2016: 16). During childhood, youth and old age, labor income is either non-existent or low, and is smaller than consumption, and the deficit thus incurred is funded through public and private age reallocations: transfers and asset-based reallocations.
2. Transfer Account comprises public and private transfers.
Public transfers include both inflows and outflows. Inflows consist of in-kind benefits (for education, health, and other purposes) and cash payments (such as pensions, unemployment benefits, child allowances, etc.). According to the NTA methodology, public transfer inflows from child allowances and other benefits geared towards families with children are attributed equally to all adult household members (Istenič et al. 2016: 42). Public transfer outflows, which represent flows from the private to the public sector, fund public transfer inflows, public asset income (such as interest on public debt), or public savings (Istenič et al. 2016: 19). Outflows consist of taxes, contributions, and other payments from the private sector, along with the transfer surplus (+) or deficit (−), a balancing item matched by public asset-based reallocations. Net public transfers do not sum to zero for the total economy because of the inflows to and outflows from the rest of the world (UN 2013: 31;Istenič et al. 2016: 20).
Private transfers can occur between and within households – i.e. they can be inter-household transfers (alimony, gifts, remittances) and intra-household transfers. The intra-household transfer inflows are equal to the intra-household transfer outflows; therefore, the net intra-household transfers amount to zero at the aggregate level. The estimation of intra-household transfers is considered one of the main contributions of the NTA (Sambt, Hammer and Istenič 2021: 187).
3. Asset-Based Reallocations Account also differentiates between the public and private component.
Public asset-based reallocations equal public transfer deficit or surplus. They are calculated as public asset income less public savings (Istenič et al. 2016: 47). Public asset income includes the income earned from publicly owned assets and interest paid on public debt (Lee and Mason 2011: 58). Public savings are equal to net savings as reported by the Serbian SNA (Statistical Office of the Republic of Serbia 2022).
Private asset-based reallocations represent the difference between private asset income (returns to capital, dividends, interest, etc.) and private savings (Lee and Mason 2011: 58).
The NTA for Serbia was developed by the SORS, and the data pertain to the year 2018. Comparison with EU25 countries relies on the NTA database of the AGENTA project for 2010 (AGENTA NTA database 2010).1 The EU25 average refers to the average over all countries, not weighted by population size.
This research shares several limitations of the NTA methodology, including its static framework, which stems from the cross-sectional nature of age profiles, its reliance on average data as NTA profiles present per-age averages, the indivisibility of certain economic flows by age, the use of a common sharing rule for household consumption of goods and services, the exclusion of informal flows and home production such as subsistence farming, its dependence on the quality of surveys, and its failure to incorporate inheritance into economic flows between individuals, among other issues (UN 2013; D’Albis and Moosa 2015; D’Albis et al. 2019). A key limitation is its reliance on a single-year NTA analysis for Serbia, underscoring the need for the NTA to become a regular product of the SORS, conducted periodically to enable continuous monitoring and support more robust future research. Additionally, the NTA for Serbia did not include time transfers or address the gender aspect.
3 RESULTS AND DISSCUSION
3.1 LIFE CYCLE ACCOUNT
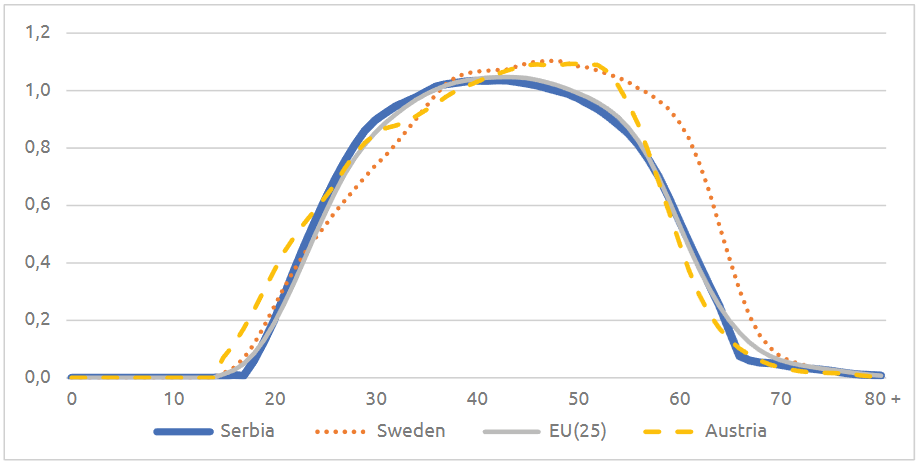
In Serbia, labor income grows more substantially relatively late during the life cycle and starts to decrease early. The curve of labor income per capita by age is concave. Labor income first occurs at the age of 15, peaking at the age of 41, after which it declines (Figure 1, Appendix). Income from earnings is substantially higher than self-employment income. The self-employment income curve is less concave, indicating its more even distribution through life cycle stages. Additionally, income from earnings drops sharply and nearly disappears beyond the age of 65, while self-employment income decreases with age at a much slower pace.
The labor income profile in Serbia closely mirrors the EU25 average, showing slight differences in the youngest age groups and somewhat more pronounced disparities in older age groups (Figure 1). Austria and Sweden stand out among European countries (Sambt, Hammer and Istenič 2021). Austria’s specific features concern the youngest age groups, owing to the widespread practice of apprenticeships, which encourage early entry into the labor market (D’Albis and Moosa 2015). In Sweden, on the other hand, labor income decreases later in the life cycle, with higher employment rates among older workers (Lee and Ogawa 2011). In high-income countries the curve is shifted to the right compared to Serbia, considering that labor income peaks at later ages (in Sweden at 49, in Austria at 50). In addition to higher economic activity rates in these generations, such a shape could also be a result of remuneration policy for older employees or the types of sectors in which they predominantly work.
Figure 1. Age profile of labour income, Serbia, 2018 (RSD per capita).
Source: SORS NTA database 2022
The age profile of total consumption in Serbia shows that after the first year of life, consumption steadily grows until adulthood, and then stagnates for a long time, albeit with minor oscillations, to finally slightly decrease after the age of 70 (Figure 2).
Figure 2. Net public transfers, inflow and outflow, per capita by age, EU25, 2010 (EUR).
Source: AGENTA NTA database 2010
Public consumption per capita is highest for school-age children and teenagers (7–19) due to education expenses. Public consumption per capita is higher than the private only for children in the 7–11 age group. In all other age groups, private consumption clearly dominates, even among the oldest-old.
The curve of private consumption per capita by age in Serbia shows a steep increase up to the age of 22, followed by slight fluctuations and a prolonged period of stagnation, before gradually declining after the age of 65.
The curves illustrating total consumption per capita by age and its components, public and private consumption, are somewhat different in the EU25 from those for Serbia (Figure 3). First, the EU25 age profile of public consumption resembles a U-curve, and that of private consumption – an inverted-U curve, which indicates their complementarity and enables life-cycle consumption smoothing (Sambt and Prskawetz 2011: 260). Additionally, per capita public consumption by the oldest-old is not lower than that by children. Second, in the EU25, public consumption—largely on education—dominates over private consumption for a longer period in childhood, from age 3 up to 16. Third, total consumption per capita rises in the oldest age groups and considerably so, also as a result of rising public consumption, primarily on health and long-term care for older people (Kluge 2009: 12). Finally, in the EU25, private and public consumption on the oldest-old are almost equal. In Scandinavian countries (Denmark, Sweden and Finland), public consumption for the oldest is particularly high and exceeds the private (AGENTA NTA database 2010).
Figure 3. Public asset-based reallocations and their components, per capita, by age, Serbia, 2018 (RSD).
Source: SORS NTA database 2022
A life-cycle deficit (LCD) is observed among children, youth, and the elderly. In Serbia, the period of surplus—when labor income exceeds consumption—lasts only 31 years, a relatively short duration considering that life expectancy reached 74.5 years in 2020 (Eurostat 2022). The deficit disappears as late as at the age of 27, and re-appears early, at the age of 58 (Figure 4). Compared to standard age dependency ratios, which use ages 20 and 65 as milestones, NTA findings indicate that in Serbia, young people remain economically dependent for an additional 7 years, and older individuals become dependent 7 years earlier. The aggregate LCD of children and youth (0–26) and the older population (58+), who cannot finance their consumption through their own labor income, represents 58.5% of total labor income—26% for the younger population and 32.5% for the older population. The aggregate LCD for the elderly is one-quarter larger than that for children and youth (Table 1, Appendix).
Figure 4. Age profile of private savings, EU-25, 2010 (EUR).
Source: AGENTA NTA database 2010
In the EU25, the surplus (negative deficit) span is somewhat longer than in Serbia, 33 years on average, especially in certain countries (Austria 34 years, Sweden 37 years) (Table 1). The first milestone, the point at which youth first incur a surplus, comes two years earlier in Austria than in Serbia, and in Sweden the second milestone, the point at which older people first lose the surplus, occurs as many as 6 years later. In these countries, however, the life expectancy is also longer, at over 80 years (Eurostat 2022). In new EU member states, the surplus span is, as a rule, shorter, with the lowest values recorded in 2010 in Lithuania (26.5) and Romania (27.4 years) (Sambt, Hammer and Istenič 2021: 189). According to Loichinger et al. (2017), by adopting Sweden’s age pattern of labor income, EU countries could offset most of the projected increase in public expenditure due to population aging. In comparison to Serbia, the aggregate life cycle deficit of children, youth and elderly as a share of total labor income is lower, at 51.4% (25% in younger ages and 26.4% in old ages) (AGENTA NTA database 2010). The share is even more favorable in several high-income countries, ranging from 45% in Austria to 48% in Sweden, Spain, Slovenia and Germany (Hammer, Prskawetz and Freund 2015).
| Country | Milestone 1 (age) | Milestone 2 (age) | Negative LCD (in years) |
| Serbia | 27 | 58 | 31 |
| Austria | 25 | 59 | 34 |
| Sweden | 27 | 64 | 37 |
| EU25 | 26 | 59 | 33 |
| Sources: SORS NTA database 2022; AGENTA NTA database 2010, author’s calculations | |||
3.2 REALLOCATIONS AMONG AGE GROUPS – TRANSFERS AND ASSET-BASED REALLOCATIONS
The age profile of net public transfers in Serbia shows that they are positive for children and youth (0–20) and for people over 60 years of age.
Considering that in-kind inflows are equal to public consumption, the curve of public transfer inflows per capita by age in Serbia follows the corresponding public consumption curve, with visibly sharper increase at older ages, due to pension cash transfers (Figure 5). Inflows per capita are the lowest for children of pre-school age, and the highest for the elderly. Aggregate public inflows for the elderly with a life cycle deficit (ages 58+) are 2.6 times higher than for those with a deficit at younger ages (0–26) (Table 1, Appendix)
Figure 5. Net public transfers, inflow and outflow, per capita by age, Serbia, 2018 (RSD).
Source: SORS NTA database 2022
The same regularity is also present in the EU25 countries (Figure 2, Appendix). In the EU25, on average, transfers for youth remain positive somewhat longer, until the age of 23. Similar to Serbia, inflows per capita are lowest for young children, but only in the first two years of life, reflecting a comparatively higher investment in early childhood development.
As expected, the curve of public transfer outflows per capita by age shows that the greatest financial burden in Serbia is borne by the middle-aged generations.
In Serbia, net public asset income is negative due to interest on public debt; thus, public asset-based reallocations are negative. In 2010, public asset income was negative in all EU25 countries except Luxembourg, primarily due to interest payments on public debt (AGENTA NTA database 2010). The greatest burden of negative public asset-based reallocations is borne by middle-aged generations (Figure 3, Appendix).
Private transfers can occur both within and between households.
The net intra-household transfer (TFW) curve by age shows that in Serbia, children and youth (ages 0–26) are almost exclusively net recipients of transfers within households. With exceptions at certain ages, older adults are also net recipients, but to a much lesser extent. Among the oldest-old, aged 77 and older, outflows exceed inflows, indicating that their contributions to the household surpass the transfers they receive (Figure 6). The shape of the EU25 curve is quite similar, except that the oldest-old still remain net TFW recipients (AGENTA NTA database 2010).
Figure 6. Net intra- and inter-household transfers, Serbia, 2018 (RSD per capita).
Source: SORS NTA database 2022
Inter-household transfers (TFB), i.e. transfers between households, can also take the form of inflows and outflows. Methodologically, these transfers are attributed to the household head, meaning children cannot be TFB recipients. The highest levels of these transfers are reported for individuals aged 35–45 and those over 70 years (Figure 6). The fact that outflows are low and net TFB are positive for all age groups gives rise to the conclusion that remittances from abroad account for the largest proportion of TFB.2 In EU25, net TFB are only positive for the population in their twenties and thirties. In Romania and Bulgaria, the curve is similar to that in Serbia (AGENTA NTA database 2010).
The aggregate net private transfers to children and youth (0–26) are three times higher than those to the older population with a life cycle deficit (58+) (Table 1, Appendix).
Private asset-based reallocations are positive due to private asset income. Private asset income in Serbia first occurs at the age of 16 (with entry into the labor market), after which it rises until the early forties. The second, lower peak is reached in the mid-fifties, only to start declining again after the age of 68 (Figure 7).
Figure 7. Private asset income, savings, and private asset-based reallocations, Serbia, 2018 (RSD per capita).
Source: SORS NTA database 2022
Private savings in Serbia are negative for most of the working-age life cycle and the amounts are relatively small. Longer positive spans occur in youth, as well as in older age. In middle-aged groups, savings are either spent, or consumption is financed through borrowing (Figure 7).
The age profile of private savings in Serbia differs drastically from the EU25 average (Figure 4, Appendix). In these countries, the profile takes the shape of an inverted-U curve, savings are negative only until the age of 27, while the peak is reached at the age of 55, followed by a decrease to lower, but still positive levels in old age.
3.3 DEFICIT FUNDING
In Serbia, the consumption deficits of children and youth are covered through public and private transfers, while the older people’s deficit is additionally funded through asset-based reallocations as well (Figure 8). Private transfers as a source of deficit funding among older persons actually predominantly consist of remittances from abroad.
Figure 8. Life-cycle deficit funding per capita, Serbia, 2018 (RSD).
Source: SORS NTA database 2022
The analysis of aggregate transfers shows that, in Serbia, transfers to children and youth in the age groups with a consumption deficit (0–26) are only 5% lower than those for older individuals (58+) (Table 1, Appendix). However, the structure by type of transfer is notably different. Private transfers are the predominant source of deficit funding for children and youth, and public transfers for older persons.
In the EU25 countries, total transfers to the younger population with a lifecycle deficit (0–25) are 60% higher than those allocated to older individuals (59+). The difference in favor of children would be even larger if in-kind transfers, the time, and unpaid labor dedicated to childcare were considered alongside cash transfers (Gál, Vanhuysse, and Vargha 2018). Contrary to the widely accepted one-sided narrative about the conflict of generations and “intergenerational transfers as a sneaky grab for resources by the old”, who represent a burden on the earners (Fürnkranz-Prskawetz et al. 2017: 16), Gál, Vanhuysse and Vargha (2018: 5) indicate that the misleading notion of gerontocracy is caused by the fact that only public transfers are visible, making transfers to older people much more socialized than those awarded to children and youth. During the course of development, the responsibility of supporting the elderly has been shifted to society as a whole, while investment in children and youth is predominantly provided through private resources.
The differences regarding deficit funding in Serbia and in the EU countries are multiple. First of all, in the EU25, private transfers to the younger population are less prominent relative to the public ones. Second, total transfers to the younger population are higher than those to the older population with a life cycle deficit, and to a significant extent (Figure 9). There is also a notable difference in funding older people’s deficit, where private transfers are almost non-existent, and asset-based reallocations are more prominent. In the EU25, the shortage of labor income in older age compared to consumption, is covered from private savings to a considerably greater extent (Figure 9).
Figure 9. Life-cycle deficit funding per capita, EU25, 2010 (EUR).
Source: AGENTA NTA database 2010
3.4 EDUCATION AND HEALTHCARE CONSUMPTION PATTERNS: ADDITIONAL INSIGHTS
The curve of public consumption on education per capita by age in Serbia follows a steep incline, reaching the highest values during primary and secondary education, dropping at the age in the life cycle when university education is attained, and records very low values after the age of 30 (Figure 10). Low public consumption on pre-school education in Serbia is partly a methodological issue (Statistical Office of the Republic of Serbia 2022).
Figure 10. Public and private consumption on education per capita by age, Serbia, 2018 (RSD). Source: SORS NTA database 2022
The shape of the curve differs from the EU25 average, primarily in the pre-school portion, which implies more substantial consumption at the youngest age with higher coverage rates in these countries (Figure 11). Public consumption on education attributed to middle-aged generations is also somewhat higher in the EU25.
Figure 11. Public and private consumption on education per capita by age, EU25, 2010 (EUR).
Source: AGENTA NTA database 2010
The age profile of private consumption on education in Serbia reveals that expenses for this purpose are concentrated among the youngest age group and the university student population (Figure 10). The shape of the curve is largely a result of policies that prescribe user fees for financing preschool and higher education institutions, including those in the private sector.
The curve for Serbia is different from the EU25 curve. In these countries as well, private consumption on education is concentrated among children and youth, but it rises steadily with age, peaking only once at the age of 18, with the completion of secondary education, and then gradually decreasing (Figure 11). In some countries, such as Slovenia, private consumption on education is high for the youngest age groups due to parental co-funding of preschool institutions, similar to the situation in Serbia (Sambt, 2009). There are no similarities with Serbia, however, in the portion of consumption related to youth, considering that in Slovenia, higher education is mainly funded from public sources.
The public consumption on healthcare per capita by age is high in Serbia during the first year of life;3 and thereafter, it decreases and remains at approximately the same level for a long time during the life cycle, only to grow rapidly with ageing, reaching its highest value at the age of 72. Beyond this age, consumption slightly decreases but remains higher than in middle and younger age groups (Figure 12).
Figure 12. Public and private consumption on healthcare per capita by age, Serbia, 2018 (RSD). Source: SORS NTA database 2022
The most notable difference in the age profiles of public consumption on healthcare in the EU25 countries is observed in the oldest age groups, where consumption consistently increases with advancing age (Figure 13). A similar age profile as in Serbia is found only in Bulgaria and Slovakia (AGENTA NTA database 2010).
Figure 13. Public consumption on healthcare per capita by age, EU25, 2010 (EUR).
Source: AGENTA NTA database 2010
The curve of private consumption on healthcare per capita by age in Serbia illustrates very low allocations for child healthcare until secondary-school age, followed by a mild and gradual increase, and finally a steeper incline in older age (Figure 12).
The age profile somewhat differs from the consumption model in the EU25 countries. In these countries, on average, somewhat higher private consumption for children is found at the youngest ages, as well as a smaller increase, or even a decline in consumption, among the oldest-old, which is offset by increased public consumption (Figure 13). The most pronounced decrease of private consumption among the oldest-old is found in Austria, Sweden, and Ireland (AGENTA NTA database 2010).
4 CONCLUSIONS AND SOCIAL SECTOR POLICY RECOMMENDATIONS
In Serbia, labor income grows substantially later in the life cycle and begins to decline relatively early. The age profile of public and private consumption does not suggest complementarity, nor does it support life-cycle consumption smoothing. Consumption on preschool education for children and on healthcare for elderly has not been ‘socialized’ to the same extent as in the EU countries. Compared to the EU25, the per capita age profile of private consumption on education in Serbia shows a notable increase during the preschool and university stages of the life cycle. In the oldest age groups, public consumption declines due to insufficient support in health care.
The life-cycle deficit – excess of consumption over labor income – disappears as late as at the age of 27, and re-appears early, at the age of 58. Compared to standard age dependency ratios, which use ages 20 and 65 as milestones, the NTA findings indicate that in Serbia, young people remain economically dependent for an additional 7 years, and older individuals become dependent 7 years earlier. Consequently, the period of life-cycle surplus (or non-deficit) spans only 31 years. However, the short duration of surplus is not the only factor contributing to the deficit burden. Aggregate life-cycle deficit of children and youth (0–26) and the older population (58+) measured as a percentage of total labor income, is notably high at 58.5%—seven percentage points above the EU25 average.
The net public transfers in Serbia are positive for children and youth (0–20) and for people over 60 years of age. Aggregate public inflows for the elderly with a life cycle deficit (58+) are 2.6 times higher than for those with a deficit at younger ages (0–26). Similar to the EU countries, private transfers are primarily influenced by net intra-household transfers, with children and youth being nearly the exclusive recipients. Aggregate net private transfers to children and youth (0–26) are three times higher than those to the older population with a life cycle deficit (58+). Age profile of public transfer outflows shows that the greatest financial burden is borne by the middle-aged generations.
In Serbia, net public asset income is negative due to interest on public debt, leading to negative public asset-based reallocations. Private asset-based reallocations are positive due to private asset income. Private savings are negative for most of the working-age life cycle, and the amounts are relatively small.
The deficit among children and youth is dominantly financed through private family transfers, while the deficit in older age is mostly covered by public transfers, and to a small extent by savings. Compared to the EU countries, private transfers for children and youth in Serbia are more significant than public transfers. Total transfers, both public and private combined, for children and youth are nearly equal to those for the elderly, whereas in the EU-25 countries, they are substantially higher. Finally, the gap between labor income and consumption in older age is less extensively covered by savings.
Based on the NTR findings, key recommendations for the social sector include interventions in early childhood education, long-term eldercare, and the pension system. Several recommendations are especially important.
In preschool education, a crucial step is to increase public investment and reduce the financial burden on families for these purposes. Enhanced investment is necessary to expand the currently low levels of preschool education coverage and to socialize a greater portion of expenses. In this regard, there is a need to reassess user fee policies, particularly considering significant disparities at the local level. Given the limited budgetary resources of many municipalities and cities, it is recommended that the national government takes a more active role in funding preschool education, which is currently a local responsibility.
In the area of long-term care, it is necessary to allocate more public funding and reduce the financial burden on elderly. LTC system reform in Serbia should focus on reducing fragmentation and expanding coverage, with a particular emphasis on developing community-based services and improving the cash benefits system. Enhanced LTC service coverage relies primarily on increasing palliative care capacity and services within the health system, along with further development of social care services under the mandate of local self-governments.
Improvements within the pension system should focus on prolonging the years of service and addressing broader issues related to enhancing pension sustainability. Key measures to achieve this include adjusting the retirement age, introducing bonuses, redefining penalties for early or late retirement, and reducing options for early labor market exit. Comprehensive pension reforms should also include further refinement of the indexation policy, measures to reform accelerated pensions, and a thorough overhaul of the voluntary private savings pillar. However, the NTA analysis shows that encouraging earlier entry of young people into the labor market is equally important, which means the impact of pension system measures is limited. For the early entry of young people into the labor market, measures outside the pension system, such as expanding apprenticeships, internships, and job placement programs, as well as providing subsidies for hiring young workers, can be of significant importance.
Finally, all policies that promote employment, productivity growth, and both economic and human development, will enhance the capacity of middle-aged generations to support others, while addressing the challenges posed by an aging population.
The development of National Transfer Accounts by the Statistical Office of the Republic of Serbia (SORS), along with the initial research into its findings, was financially supported by the United Nations Population Fund (UNFPA) Serbia.
Data availability statement
This study was based on the data provided by the Statistical Office of the Republic of Serbia. As such, the data cannot be shared publicly. Results in their aggregated form can be obtained from the authors upon request. The data for EU25 was obtained from the publicly available AGENTA database.
References
- Abío, G., Patxot, C., Sánchez-Romero, M., & Souto, G. (2017). The welfare state and demographic dividends. Demographic Research, 36(48), 1453–1490. https://doi.org/10.4054/DemRes.2017.36.48
- AGENTA NTA database (2010). National Transfer Accounts (NTA) Database. https://dataexplorer.wittgensteincentre.org/nta
- Chłoń-Domińczak, A., Abramowska-Kmon, A., Kotowska, I., Latkowski, W., & Strzelecki, P. (2019). Welfare state and the age distribution of public consumption and public transfers in the EU countries. Vienna Yearbook of Population Research, 17, 71–97. https://doi.org/10.1553/populationyearbook2019s071
- D’Albis, H., & Moosa, D. (2015). Generational Economics and the National Transfer Accounts. Journal of Demographic Economics, 81(4), 409–441. https://doi.org/10.1017/dem.2015.14
- D’Albis, H., Bonnet, C., Chojnicki, X., El Mekkaoui, N., Greulich, A., et al. (2019). Financing the consumption of the young and old in France. Population and Development Review, 45(1), 103–132. https://doi.org/10.1111/padr.12204
- Eurostat (2022). Life expectancy by age and sex (demo_mlexpec). Eurostat Database. https://ec.europa.eu/eurostat/data/database
- Fürnkranz-Prskawetz, A., Hammer, B., & Rengs, B. (Eds.). (2017). Ageing Europe: An application of national transfer accounts for explaining and projecting trends in public finances. Vienna Institute of Demography, Austrian Academy of Sciences. https://www.utzo.si/wp-content/uploads/2018/05/Ageing-Europe.pdf
- Gál R. I., Vanhuysse P. & Vargha L. (2018). Pro-elderly welfare states within pro-child societies. Journal of European Public Policy, 25(6), 944–958. https://doi.org/10.1080/13501763.2017.1401112
- Hammer, B., Prskawetz, A., & Freund, I. (2015). Production activities and economic dependency by age and gender in Europe: A cross-country comparison. The Journal of the Economics of Ageing, 5, 86–97. https://doi.org/10.1016/j.jeoa.2014.09.007
- Hammer, B., Prskawetz, A., Gal, R. I., & Vargha, L. (2019). Human capital investment and the sustainability of public transfer systems across Europe: An evaluation based on National Transfer Accounts. Journal of Population Ageing, 12(4). https://doi.org/10.1007/s12062-018-9224-8
- Istenič, T., Hammer, B., Šeme, A., Lotrič, Dolinar, A., & Sambt, J. (2016). European National Transfer Accounts (The European NTA Manual). Available at: http://dataexplorer.wittgensteincentre.org/nta
- Istenič, T., Hammer, B., & Sambt, J. (2019). European national (time) transfer accounts. Vienna Yearbook of Population Research, 17, 201–221. https://doi.org/10.1553/populationyearbook2019s201
- Kluge, F. A. (2009). Transfers, consumption and income over the lifecycle in Germany. Rostock: Max Planck Institute for Demographic Research (MPIDR Working Papers WP-2009-014). https://www.ntaccounts.org/doc/repository/K2009.pdf
- Kluge, F. A., Goldstein, J. R., & Vogt, T. C. (2019). Transfers in an aging European Union. The Journal of the Economics of Ageing, 13, 45–54. https://doi.org/10.1016/j.jeoa.2018.07.004
- Lee, R. D. (1994). Population age structure, intergenerational transfers, and wealth: A new approach, with applications to the U.S. Journal of Human Resources, Special Issue: The Family and Intergenerational Relations, 29(4), 1027–1063. https://doi.org/10.2307/146133
- Lee, R. D., & Mason, A. (Eds.). (2011). Population Aging and the Generational Economy: A Global Perspective. Cheltenham: Edward Elgar Publishing Limited. https://doi.org/10.4337/9780857930583
- Lee, R., & Donehower, G. (2011). Private transfers in comparative perspective. In R. Lee & A. Mason (Eds.), Population Aging and the Generational Economy: A Global Perspective (pp. 185–209). Cheltenham: Edward Elgar Publishing Limited. https://doi.org/10.4337/9780857930583.00015
- Lee, S. H., & Ogawa, N. (2011). Labor income over the lifecycle. In R. Lee & A. Mason (Eds.), Population Aging and the Generational Economy: A Global Perspective (pp. 109–135). Cheltenham: Edward Elgar Publishing Limited. https://doi.org/10.4337/9780857930583.00012
- Loichinger, E., Hammer, B., Prskawetz, A., Freiberger, M., & Sambt, J. (2017). Quantifying economic dependency. European Journal of Population, 33(1), 351–380. https://doi.org/10.1007/s10680-016-9405-1
- Mason, A., Lee, R. D., Donehower, G., Lee, S.-H., Miller, T., Tung, A.-C., & Chawla, A. (2009). National Transfer Accounts manual. (NTA Working Paper No. 2009/08). https://www.ntaccounts.org/doc/repository/NTA%20Manual%20V1%20Draft.pdf
- Mason, A., & Lee, R. (2011). Introducing age into national accounts. In R. Lee & A. Mason (Eds.), Population Aging and the Generational Economy: A Global Perspective (pp. 55–78). Cheltenham: Edward Elgar Publishing Limited. https://doi.org/10.4337/9780857930583.00009
- Mason, A., & Lee, R. (2013). Labor and consumption across the lifecycle. The Journal of the Economics of Ageing, 1–2, 16–27. https://doi.org/10.1016/j.jeoa.2013.06.002
- Matković, G. (2023). National Transfer Accounts and the Recommendations in the social sector of the Republic of Serbia (Unpublished document). United Nations Development Fund, Serbia.
- Poljak, I., & Manić, S. (2024). Exploring the economic impact of population aging in Serbia through national transfer accounts. In I. Barković Bojanić & A. Erceg (Eds.), Economics and business of aging (pp. 123–140). Osijek: Faculty of Economics and Business. https://www.ceeol.com/search/chapter-detail?id=1261159
- Sambt, J. (2009). National transfer accounts for Slovenia (Doctoral dissertation). http://www.cek.ef.uni-lj.si/doktor/sambt283.pdf
- Sambt, J., & Prskawetz, A. (2011). National transfer accounts for Austria: Low levels of education and the generosity of the social security system. In R. Lee & A. Mason (Eds.), Population aging and the generational economy: A global perspective (pp. 256–268). Edward Elgar Publishing. Cheltenham: Edward Elgar Publishing Limited. https://doi.org/10.4337/9780857930583.00020
- Sambt, J., Hammer, B., & Istenič, T. (2021). The European National Transfer Accounts: Data and Applications. Economic and Business Review, 23(3), 184–193. https://doi.org/10.15458/2335-4216.1287
- Sánchez-Romero, M., Abío, G., Botey, M., Prskawetz, A., Sambt, J., Solé Juvés, M., Souto, G., Vargha, L., & Patxot, C. (2019). Welfare state winners and losers in ageing societies. Vienna Yearbook of Population Research, 17(1). https://doi.org/10.1553/populationyearbook2019s009
- Sánchez-Romero, M., Schuster, P., & Prskawetz, A. (2023). Redistributive effects of pension reforms: Who are the winners and losers? Journal of Pension Economics & Finance, 23(2). https://doi.org/10.1017/S147474722300015X
- SORS NTA database (2022). National Transfer Accounts (NTA) Database (Unpublished).
- Spielauer, M., Horvat, T., Fink, M., Abio, G., Patxot, C., Souto, G. & Istenič, T. (2022). Measuring the lifecycle impact of welfare state policies in the face of ageing. Economic Analysis and Policy 75: 1–25. https://doi.org/10.1016/j.eap.2022.05.002
- Statistical Office of the Republic of Serbia (2022). An analytical report of the National transfer accounts for Serbia. (Unpublished document).
- UN (2013). National Transfer Accounts Manual: Measuring and Analysing the Generational Economy. New York: United Nations. https://doi.org/10.18356/42d43461-en
- Vanhuysse, P., Medgyesi, M., & Gál, R. I. (2023). Taxing reproduction: The full transfer cost of rearing children in Europe. Royal Society Open Science, 10(10). https://doi.org/10.1098/rsos.230759
Footnotes
- The label “EU25” refers to the 25 countries that were part of the EU-28 at the time of implementation of the AGENTA project and participated in it: Austria, Belgium, Bulgaria, Republic of Cyprus, Czech Republic, Denmark, Estonia, Finland, France, Germany, Greece, Hungary, Ireland, Italy, Latvia, Lithuania, Luxembourg, Poland, Portugal, Romania, Slovakia, Slovenia, Spain, Sweden, and the UK. Data for Malta, Croatia and the Netherlands are not included.
- Emigrant remittances are treated as transfer inflows and their amount is low in the majority of countries (Mason and Lee 2011: 72). In a closed economy, the sum of all TFB would equal zero. In an open economy, the sum can be positive and significant if households from one country transfer funds to households in another country (Lee and Donehower 2011: 196).
- Vaccination, mandatory health checks, etc.
APPENDIX

Figure 1. Age profile of labour income, Serbia, 2018 (RSD per capita). Source: SORS NTA database 2022

Figure 2. Net public transfers, inflow and outflow, per capita by age, EU25, 2010 (EUR). Source: AGENTA NTA database 2010

Figure 3. Public asset-based reallocations and their components, per capita, by age, Serbia, 2018 (RSD). Source: SORS NTA database 2022

Figure 4. Age profile of private savings, EU-25, 2010 (EUR). Source: AGENTA NTA database 2010
| Total | 0–26 | 27–57 | 58+ | |
|---|---|---|---|---|
| LIFE CYCLE DEFICIT (LCD) | 999,814 | 648,067 | -457,930 | 809,677 |
| CONSUMPTION | 3,491,232 | 842,366 | 1,552,907 | 1,095,959 |
| PUBLIC | 839,044 | 308,047 | 276,360 | 254,637 |
| PRIVATE | 2,652,188 | 534,318 | 1,276,547 | 841,322 |
| LABOR INCOME | 2,491,418 | 194,299 | 2,010,837 | 286,282 |
| CURRENT PUBLIC AGE REALLOCATION | -230,960 | |||
| NET PUBLIC TRANSFERS | 46,201 | 130,873 | -576,820 | 492,147 |
| PUBLIC TRANSFER INFLOWS | 1,671,578 | 343,409 | 432,083 | 896,086 |
| PUBLIC TRANSFER OUTFLOWS | 1,625,377 | 212,536 | 1,008,903 | 403,939 |
| TAXES AND CONTRIBUTIONS | 1,902,539 | 248,778 | 1,180,942 | 472,819 |
| SURPLUS-DEFICIT | -277,161 | -36,242 | -172,039 | -68,880 |
| ASSET-BASED REALLOCATIONS | -277,161 | -36,242 | -172,039 | -68,880 |
| ASSET INCOME | -77,950 | -10,193 | -48,385 | -19,372 |
| LESS PUBLIC SAVINGS | 199,211 | 26,049 | 123,654 | 49,508 |
| CURRENT Private AGE REALLOCATION | 1,230,774 | |||
| NET PRIVATE TRANSFERS | 407,060 | 492,731 | -248,353 | 162,682 |
| PRIVATE TRANSFER INFLOWS | 1,163,943 | 526,534 | 352,762 | 284,647 |
| PRIVATE TRANSFER OUTFLOWS | 756,883 | 33,803 | 601,114 | 121,966 |
| PRIVATE ASSET-BASED REALLOCATIONS | 823,714 | 60,704 | 539,282 | 223,728 |
| PRIVATE ASSET INCOME | 846,896 | 87,671 | 497,941 | 261,284 |
| LESS: PRIVATE SAVING | 23,182 | 26,967 | -41,341 | 37,556 |
| LCD as a % of total labor income | 26,0 | 32,5 | ||
| PUBLIC + PRIVATE TRANSFERS | 453,261 | 623,605 | -825,173 | 654,829 |
| Source: SORS NTA database 2022, author's calculations | ||||
Article Details
Published by the Institute of Social Sciences - Center for Demographic Research


References
Abío, G., Patxot, C., Sánchez-Romero, M., & Souto, G. (2017). The welfare state and demographic dividends. Demographic Research, 36(48), 1453–1490. https://doi.org/10.4054/DemRes.2017.36.48 DOI: https://doi.org/10.4054/DemRes.2017.36.48
AGENTA NTA database (2010). National Transfer Accounts (NTA) Database. https://dataexplorer.wittgensteincentre.org/nta/
Chłoń-Domińczak, A., Abramowska-Kmon, A., Kotowska, I., Latkowski, W., & Strzelecki, P. (2019). Welfare state and the age distribution of public consumption and public transfers in the EU countries. Vienna Yearbook of Population Research, 17, 71–97. https://doi.org/10.1553/populationyearbook2019s071 DOI: https://doi.org/10.1553/populationyearbook2019s071
D’Albis, H., & Moosa, D. (2015). Generational Economics and the National Transfer Accounts. Journal of Demographic Economics, 81(4), 409-441. https://doi.org/10.1017/dem.2015.14 DOI: https://doi.org/10.1017/dem.2015.14
D’Albis, H., Bonnet, C., Chojnicki, X., El Mekkaoui, N., Greulich, A., et al. (2019). Financing the consumption of the young and old in France. Population and Development Review, 45(1), 103–132. https://doi.org/10.1111/padr.12204 DOI: https://doi.org/10.1111/padr.12204
Eurostat (2022). Life expectancy by age and sex (demo_mlexpec). Eurostat Database. https://ec.europa.eu/eurostat/data/database
Fürnkranz-Prskawetz, A., Hammer, B., & Rengs, B. (Eds.). (2017). Ageing Europe: An application of national transfer accounts for explaining and projecting trends in public finances. Vienna Institute of Demography, Austrian Academy of Sciences. https://www.utzo.si/wp-content/uploads/2018/05/Ageing-Europe.pdf
Gál R. I., Vanhuysse P. & Vargha L. (2018). Pro-elderly welfare states within pro-child societies. Journal of European Public Policy, 25(6), 944-958. https://doi.org/10.1080/13501763.2017.1401112 DOI: https://doi.org/10.1080/13501763.2017.1401112
Hammer, B., Prskawetz, A., & Freund, I. (2015). Production activities and economic dependency by age and gender in Europe: A cross-country comparison. The Journal of the Economics of Ageing, 5, 86- 97. https://doi.org/10.1016/j.jeoa.2014.09.007 DOI: https://doi.org/10.1016/j.jeoa.2014.09.007
Hammer, B., Prskawetz, A., Gal, R. I., & Vargha, L. (2019). Human capital investment and the sustainability of public transfer systems across Europe: An evaluation based on National Transfer Accounts. Journal of Population Ageing, 12(4). https://doi.org/10.1007/s12062-018-9224-8 DOI: https://doi.org/10.1007/s12062-018-9224-8
Istenič, T., Hammer, B., Šeme, A., Lotrič, Dolinar, A., & Sambt, J. (2016). European National Transfer Accounts (The European NTA Manual). Available at: http://dataexplorer.wittgensteincentre.org/nta/
Istenič, T., Hammer, B., & Sambt, J. (2019). European national (time) transfer accounts.Vienna Yearbook of Population Research, 17, 201–221. https://doi.org/10.1553/populationyearbook2019s201 DOI: https://doi.org/10.1553/populationyearbook2019s201
Kluge, F. A. (2009). Transfers, consumption and income over the lifecycle in Germany. Rostock: Max Planck Institute for Demographic Research (MPIDR Working Papers WP-2009-014). https://www.ntaccounts.org/doc/repository/K2009.pdf DOI: https://doi.org/10.4054/MPIDR-WP-2009-014
Kluge, F. A., Goldstein, J. R., & Vogt, T. C. (2019). Transfers in an aging European Union. The Journal of the Economics of Ageing, 13, 45-54. https://doi.org/10.1016/j.jeoa.2018.07.004 DOI: https://doi.org/10.1016/j.jeoa.2018.07.004
Lee, R. D. (1994). Population age structure, intergenerational transfers, and wealth: A new approach, with applications to the U.S. Journal of Human Resources, Special Issue: The Family and Intergenerational Relations, 29(4), 1027–1063. https://doi.org/10.2307/146133 DOI: https://doi.org/10.2307/146133
Lee, R. D., & Mason, A. (Eds.). (2011). Population Aging and the Generational Economy: A Global Perspective. Cheltenham: Edward Elgar Publishing Limited. https://doi.org/10.4337/9780857930583 DOI: https://doi.org/10.4337/9780857930583
Lee, R., & Donehower, G. (2011). Private transfers in comparative perspective. In R. Lee & A. Mason (Eds.), Population Aging and the Generational Economy: A Global Perspective (pp. 185-209). Cheltenham: Edward Elgar Publishing Limited. https://doi.org/10.4337/9780857930583.00015 DOI: https://doi.org/10.4337/9780857930583.00015
Lee, S. H., & Ogawa, N. (2011). Labor income over the lifecycle. In R. Lee & A. Mason (Eds.), Population Aging and the Generational Economy: A Global Perspective (pp. 109–135). Cheltenham: Edward Elgar Publishing Limited. https://doi.org/10.4337/9780857930583.00012 DOI: https://doi.org/10.4337/9780857930583.00012
Loichinger, E., Hammer, B., Prskawetz, A., Freiberger, M., & Sambt, J. (2017). Quantifying economic dependency. European
Journal of Population, 33(1), 351-380. https://doi.org/10.1007/s10680-016-9405-1 DOI: https://doi.org/10.1007/s10680-016-9405-1
Mason, A., Lee, R. D., Donehower, G., Lee, S.-H., Miller, T., Tung, A.-C., & Chawla, A. (2009). National Transfer Accounts manual. (NTA Working Paper No. 2009/08). https://www.ntaccounts.org/doc/repository/NTA%20Manual%20V1%20Draft.pdf
Mason, A., & Lee, R. (2011). Introducing age into national accounts. In R. Lee & A. Mason (Eds.), Population Aging and the Generational Economy: A Global Perspective (pp. 55–78). Cheltenham: Edward Elgar Publishing Limited. https://doi.org/10.4337/9780857930583.00009 DOI: https://doi.org/10.4337/9780857930583.00009
Mason, A., & Lee, R. (2013). Labor and consumption across the lifecycle. The Journal of the Economics of Ageing, 1–2, 16–27. https://doi.org/10.1016/j.jeoa.2013.06.002 DOI: https://doi.org/10.1016/j.jeoa.2013.06.002
Matković, G. (2023). National Transfer Accounts and the Recommendations in the social sector of the Republic of Serbia (Unpublished document). United Nations Development Fund, Serbia.
Poljak, I., & Manić, S. (2024). Exploring the economic impact of population aging in Serbia through national transfer accounts. In I. Barković Bojanić & A. Erceg (Eds.), Economics and business of aging (pp. 123-140). Osijek: Faculty of Economics and Business. https://www.ceeol.com/search/chapter-detail?id=1261159
Sambt, J. (2009). National transfer accounts for Slovenia (Doctoral dissertation). http://www.cek.ef.uni-lj.si/doktor/sambt283.pdf
Sambt, J., & Prskawetz, A. (2011). National transfer accounts for Austria: Low levels of education and the generosity of the social security system. In R. Lee & A. Mason (Eds.), Population aging and the generational economy: A global perspective (pp. 256–268). Edward Elgar Publishing. Cheltenham: Edward Elgar Publishing Limited. https://doi.org/10.4337/9780857930583.00020 DOI: https://doi.org/10.4337/9780857930583.00020
Sambt, J., Hammer, B., & Istenič, T. (2021). The European National Transfer Accounts: Data and Applications. Economic and Business Review, 23(3), 184-193. https://doi.org/10.15458/2335-4216.1287 DOI: https://doi.org/10.15458/2335-4216.1287
Sánchez-Romero, M., Abío, G., Botey, M., Prskawetz, A., Sambt, J., Solé Juvés, M., Souto, G., Vargha, L., & Patxot, C. (2019). Welfare state winners and losers in ageing societies. Vienna Yearbook of Population Research, 17 (1). https://doi.org/10.1553/populationyearbook2019s009 DOI: https://doi.org/10.1553/populationyearbook2019s009
Sánchez-Romero, M., Schuster, P., & Prskawetz, A. (2023). Redistributive effects of pension reforms: Who are the winners and losers? Journal of Pension Economics & Finance, 23(2). https://doi.org/10.1017/S147474722300015X DOI: https://doi.org/10.1017/S147474722300015X
SORS NTA database (2022). National Transfer Accounts (NTA) Database (Unpublished).
Spielauer, M., Horvat, T., Fink, M., Abio, G., Patxot, C., Souto, G. & Istenic, T. (2022). Measuring the lifecycle impact of welfare state policies in the face of ageing. Economic Analysis and Policy 75: 1-25. https://doi.org/10.1016/j.eap.2022.05.002 DOI: https://doi.org/10.1016/j.eap.2022.05.002
Statistical Office of the Republic of Serbia (2022). An analytical report of the National transfer accounts for Serbia. (Unpublished document).
UN (2013). National Transfer Accounts Manual: Measuring and Analysing the Generational Economy. New York: United Nations. https://doi.org/10.18356/42d43461-en DOI: https://doi.org/10.18356/42d43461-en
Vanhuysse, P., Medgyesi, M., & Gál, R. I. (2023). Taxing reproduction: The full transfer cost of rearing children in Europe. Royal Society Open Science, 10(10). https://doi.org/10.1098/rsos.230759 DOI: https://doi.org/10.1098/rsos.230759