
Socioeconomic Determinants of Perceived Exposure to Noise and Pollution: Urban–Rural Differences across European Countries
Article Sidebar
Main Article Content
Abstract
Environmental issues and climate change pose a growing threat to public health and longevity across Europe, with air and noise pollution contributing significantly to premature mortality and diminished quality of life. In this paper, we investigate perceived environmental risks. The probit method is used to estimate the probability of perceived exposure to noise or pollution controlling for individual and household characteristics. The dataset is the 2023 Survey of Income and Living Conditions for European Union countries (except Germany, Ireland, Slovenia and the Netherlands) and Serbia. Our results reveal significant heterogeneity between European countries; however, in all but one country, living in cities, towns or suburbs vs. living in rural areas has a significant influence on the probability of perceived exposure to noise or pollution. The marginal effect for urban areas ranges from 2% in Slovakia to 40% in Greece. There is no significant difference between genders. Elderly people have a lower probability of perceived exposure. When compared to tenants, homeowners have a lower probability of perceived exposure, suggesting that individuals chose to buy property for living in areas with fewer environmental problems. In the majority of countries, people at-risk-of-poverty have a higher probability of perceived exposure to noise or pollution. In Serbia and Latvia, the effect is opposite: poverty is higher in rural than in urban areas, and the former areas have lower perceived exposure to noise or pollution. Our results suggest that effective policy measures are necessary to reduce noise and pollution in urban areas all around Europe. Additionally, policies for reducing urban-rural inequalities within countries could have a direct effect on a more equal distribution of risks between cities, towns and rural areas.
1 Introduction
Contemporary environmental challenges represent one of the key issues of public health and social development in Europe. Climate change, ecosystem degradation, and increasing pressures of urbanization contribute to the growing exposure of populations to various forms of pollution. Among them, air pollution and noise stand out as factors that directly affect the quality of life, health, and longevity. According to the World Health Organization (WHO), in the European region1, approximately 569,000 premature deaths were linked to outdoor air pollution, while an additional 154,000 deaths were attributed to household pollution (World Health Organization, 2024). The European Environment Agency estimates that reducing concentrations of fine particulate matter with an aerodynamic diameter of 2.5 micrometres or less (PM2.5), nitrogen dioxide (NO₂), and ozone (O₃) to levels recommended by WHO could prevent more than 350,000 deaths annually in the European Union (EU) (European Environment Agency, 2024).
In addition to air pollution, environmental noise is recognized as one of the leading health risks among EU and European Economic Area countries, with the estimates suggesting that more than one-fifth of the population is exposed to harmful transport noise levels (European Environment Agency, 2025). Based on WHO criteria, this share rises to over 30%, i.e., nearly one-third of the European population. Road traffic is identified as the dominant source of environmental noise, especially in densely populated urban areas. Long-term exposure to noise is associated with cardiovascular and metabolic diseases, sleep disorders, depression, and reduced cognitive performance (World Health Organization Regional Office for Europe, 2025).
Regional and urban-rural inequalities further contribute to the concentration of exposure to both risks in certain areas. While urban environments are most often affected by higher levels of pollution, rural areas may offer more favorable ecological conditions, but face other socioeconomic challenges (lower possibilities for employment and earnings, infrastructural deficits, etc.). Many studies have investigated how carbon dioxide (CO₂) emissions, PM2.5, and other pollutants influence both health and the environment (Burnett et al., 2018; Lelieveld et al., 2019). However, relatively little is known about which individual and household characteristics shape the perception of exposure to noise and pollution. Perception of exposure is crucial for understanding population behavior, risk awareness, and support for public policies.
Against this background, the aim of this research is to provide empirical evidence on which individual and household factors influence the perception of exposure to noise and pollution across European countries. More specifically, we examine how living in an urban versus rural area affects the probability of perceiving exposure to noise or pollution, as well as how sociodemographic characteristics shape these perceptions. Using data from the 2023 Survey of Income and Living Conditions (EU-SILC) (Eurostat, 2024) and applying the probit method, we analyze how populations across Europe perceive their own exposure to these risks. The results reveal significant heterogeneity among countries, but also clear patterns of perception linking urban living with a heightened sense of exposure. This study advances the existing literature in several important ways. First, it uses the most recent 2023 EU SILC wave, collected after the Coronavirus Disease 2019 (COVID 19) pandemic and subsequent socioeconomic shocks, allowing us to capture potentially altered patterns of environmental perception that earlier studies were not able to observe. Second, the geographical scope is substantially broader than in previous research, covering 24 European countries and Serbia, thereby enabling a more comprehensive comparative assessment of urban–rural differences. Third, the inclusion of Serbia, an upper middle income country outside the EU, adds analytical value by illustrating how distinct spatial distributions of poverty shape subjective environmental exposure. Fourth, we incorporate a wider set of individual - and household level characteristics than earlier studies, allowing for a more nuanced identification of socioeconomic determinants. Finally, our results reveal new cross country patterns of environmental inequality, particularly regarding poverty, tenure status, and age.
Understanding these processes is essential for shaping sustainable development strategies and improving the quality of life of European populations. Implementing effective environmental protection measures, together with policies that address social inequalities, can contribute to reducing risks and creating a fairer society in which the benefits of a clean and healthy environment are accessible to all citizens, regardless of one’s place of residence or socioeconomic status.
The paper is structured as follows. We present findings from the existing literature on the influence of subjective measures of environmental issues on individuals’ well-being and health. Data characteristics and descriptive statistics are presented in Section 3. Empirical econometric methodology is briefly explained in Section 4. Then we present the main results from econometric analyses and robustness checks. Lastly, we draw some conclusions and policy implications.
2 Literature Review
The literature on the subjective perception of exposure to pollution and noise shows that individuals’ experience of their environment results from a complex interaction between objective conditions and personal characteristics, with subjective perception often exerting a stronger influence on the quality of life, mental health, and overall life satisfaction than the measured levels of pollutants themselves (Herrera & Cabrera-Barona, 2022; Lercher, 1996). Numerous studies demonstrate that self reported problems related to air pollution and noise do not always align with objective indicators, but are instead shaped by visual and olfactory cues, everyday environmental experiences, media narratives, and trust in institutions (Maione et al., 2021; Miedema & Vos, 1999). These findings confirm that subjective perception is not merely a reaction to the physical characteristics of the environment, but also to social, informational, and psychological factors that influence how individuals interpret and evaluate risks in their immediate surroundings. Maione et al. (2021) further show that citizens across several European countries often misjudge the relative contribution of different pollution sources, highlighting the importance of risk perception and environmental awareness in shaping attitudes toward environmental problems.
In the field of noise research, the European Environment Agency emphasizes that subjective annoyance is one of the key indicators of the health impacts of noise, often more strongly associated with stress, sleep disturbance, and reduced quality of life than the decibel level itself (European Environment Agency, 2025). Recent data indicate that more than one fifth of Europeans are exposed to harmful levels of transport noise, while millions report long term annoyance and sleep disruption. Classic studies (Lercher, 1996; Miedema & Vos, 1999) further demonstrate that noise perception depends on contextual factors, such as the type of settlement, residents’ expectations, perceived control over the noise source, and trust in local authorities. Consequently, residents of urban areas, particularly those with heavy traffic, are more likely to report noise problems even when objective levels are not extreme.
Herrera and Cabrera-Barona (2022) show that perceptions of visual and olfactory pollution, as well as noise, significantly affect self rated health, happiness, and life satisfaction, with unpleasant odors and noise emerging as some of the strongest predictors of reduced well being. Similar findings appear in studies that jointly analyze perceptions of noise and air pollution in urban environments, showing that these two perceptions are highly correlated but not identical, and that housing status, length of residence, and socioeconomic characteristics shape how individuals evaluate their surroundings (Chiarini et al., 2020). Additional research highlights the role of broader social factors, including information exposure, environmental awareness, and institutional trust, in shaping subjective perceptions of pollution (Bickerstaff & Walker, 2001), as well as the influence of spatial inequalities and socioeconomic differences on everyday environmental experience (Evans & Kantrowitz, 2002). Urban health studies further demonstrate that cumulative exposure to multiple stressors, including noise, pollution, crowding, and limited access to green space, affects subjective assessments of environmental quality and well being (Evans, 2003).
The environmental inequality literature consistently emphasizes that lower income groups tend to be more exposed to environmental risks, both objectively and subjectively, although this pattern depends on the spatial distribution of poverty (Walker, 2012). The relationship between socioeconomic status and noise exposure is heterogeneous and depends on local context. Inner cities in Western Europe are often wealthier than the suburbs and more exposed to traffic noise (e.g., Havard et al. (2011) for Paris, Cesaroni et al. (2010) for Rome). However, people of lower socioeconomic status are more likely to live on busy to extremely busy main roads and are more exposed to the noise in Germany (Hoffmann et al., 2003). Similarly, noise adversely affects vulnerable, marginalized, and less privileged neighborhoods in the Netherlands (Hayward & Helbich, 2024). Pollution is higher in areas with lower income per capita in Bologna (Drigo, 2024). In the countries where poverty is predominantly urban, subjective exposure tends to be higher among the poor, whereas in the countries with predominantly rural poverty, lower income residents may report lower exposure to noise and pollution precisely because they live in less urbanized areas (Banzhaf et al., 2019; Libertun de Duren et al., 2022). Age and housing status also shape subjective environmental assessments: older residents often report fewer problems, which the literature attributes to adaptation, longer residence in the same environment, and a lower likelihood of living in central urban areas (Lercher, 1996; Miedema & Vos, 1999). Homeowners, meanwhile, are less likely to report environmental problems, a pattern explained by the concept of residential self selection, whereby individuals who purchase property tend to choose locations with fewer perceived environmental risks, while renters more often reside in environmentally disadvantaged or compromised areas (Banzhaf & Walsh, 2008).
Studies confirm that subjective perceptions of pollution and noise represent a multidimensional phenomenon shaped by physical, social, and psychological factors. However, despite a rich theoretical and empirical foundation, there remains a notable lack of comparative research based on harmonized data across many European countries, particularly studies that simultaneously examine subjective perceptions of both noise and pollution, socioeconomic differences, and the urban-rural context. This gap underscores the need for comprehensive comparative analyses capable of identifying shared patterns and country specific dynamics in subjective environmental exposure. In this regard, our study addresses an important gap in the literature and contributes to a more nuanced understanding of subjective exposure to noise and pollution in contemporary Europe.
3 Data and Descriptive Analysis
The primary data source used in this study is the 2023 Survey of Income and Living Conditions data for EU countries (excluding Germany, Ireland, Slovenia and the Netherlands) and Serbia (Eurostat, 2024). The EU-SILC is a primary data source for poverty, living conditions and social exclusion. The EU-SILC contains data on individual and household characteristics. The data are representative on the national level and are expressed by the degree of urbanization and region. The dataset contains two variables for perceived environmental risks, i.e., self-reported household exposure to the noise from neighbors or from the street, and exposure to pollution, grime, or other environmental problems. Those two variables are not available for Ireland, and for Germany there is a high share of missing observations for both variables (42,3%), therefore, we excluded those two countries from the analysis. Additionally, we exclude Slovenia, since there is no data on the degree of urbanization which appear to be the most significant predictor of perceived exposure. EU-SILC microdata for the Netherlands was not provided by Eurostat. Therefore, our sample consists of the following EU countries and Serbia: Austria (AT), Belgium (BE), Bulgaria (BG), Cyprus (CY), Czech Republic (CZ), Denmark (DK), Estonia (EE), Greece (EL), Spain (ES), Finland (FI), France (FR), Croatia (HR), Hungary (HU), Italy (IT), Lithuania (LT), Luxembourg (LU), Latvia (LV), Malta (MT), Poland (PL), Portugal (PT), Romania (RO), Serbia (RS), Sweden (SE), and Slovakia (SK).2 Our dependent variable equals 1 if the household perceives exposure to either noise or pollution (i.e., at least one of two environmental risks), and 0 otherwise. We opted to explore perceived exposure to either noise or pollution instead of investigating them separately due to several reasons. The causes of noise and pollution may be the same, e.g., road traffic has both negative effects: noise and emission of gases (European Environment Agency, 2024; World Health Organization Regional Office for Europe, 2025; Chiarini et al., 2020). The number of observations for pollution is much lower than for noise in our dataset. This is in line with previous findings that people are generally more aware of the presence of noise than of pollution (Betti et al., 2020). Although probit method could be used when the dependent variable is highly unbalanced, the results could be biased if we estimate two equations either separately or jointly. Therefore, for the main analysis, we opted to estimate the probability to perceive exposure to either of the risks, whereas for robustness check we estimated jointly the probability of perceiving exposure to the noise and probability of perceiving exposure to the pollution by using bivariate probit method.
We control for the following explanatory variables that are available in the EU-SILC, and that may influence perceived exposure to risks: living in a city, age, gender, poverty, education level, household structure and tenure status.
In all the analyzed countries, the share of the population that lives in rural areas is much smaller than that of the population living in urban areas (cities or towns and suburbs). The only country with an equal distribution of population between urban and rural areas is Slovakia, where 49% of the population lives in rural areas. Malta is a small Mediterranean country, where the majority of the population is concentrated near the sea, where cities and towns are located, with a small share of the population living in the countryside. We observe that 97% of the population lives in urban areas in Malta. Southern European countries also have high shares of urban population; however, the highest percentage is observed in Malta (United Nations, 2025). Figure 1 presents the share of the population that is exposed to noise and/or pollution. There is significant heterogeneity between the countries. Malta has very high exposure to either noise or pollution; almost half of the population is exposed to at least one risk. Also, around a fifth of the population is exposed to both risks. The particularly high level of perceived exposure to noise or pollution observed in Malta is consistent with recent evidence documenting persistent concerns about environmental noise in the country. Malta’s population density within its agglomeration is four times the Eurostat threshold for a high-density cluster, challenging mitigation of noise exposure (Hjerp, 2026).
Figure 1. Exposure to noise, pollution, noise or pollution, noise and pollution %
Source: Authors’ calculations based on 2023 EU-SILC (Eurostat, 2024).
Perceived exposure to noise or pollution is also high in Greece, Spain, Finland, France, Luxembourg and Portugal. Exposure to noise and pollution is the highest in Malta, followed by Greece (10%). The perception of both risks is around 5-6% in other countries, with the lowest values observed in Croatia and Sweden (around 2%). In many countries perceived exposure to noise is higher than when it comes to pollution, which is in line with previous findings that noise is easier to observe (Betti et al., 2020; Chiarini et al., 2020; Miedema & Vos, 1999).
We investigate how perceived exposure to noise or pollution differs by different individual and household characteristics. Degree of urbanization is defined as follows: cities (i.e., densely populated areas), towns and suburbs (i.e., intermediate populated areas), and rural areas (i.e., thinly populated areas). For two countries, Estonia and Latvia, cities, towns, and suburbs are merged into one category. Therefore, we define the dummy variable cities equals to 1 if a household resides in a city, town, or suburb (i.e., densely or intermediate populated area) and 0 if it resides in a rural area (i.e., thinly populated area). Our other household-level control variables are: at-risk-of-poverty indicator (1 if a household is below the at-risk-of-poverty threshold, 0 otherwise); tenure status (1 if a household is an owner with or without outstanding mortgage or a rent-free tenant, 0 if a tenant rents at either market or reduced price); households with or without dependent children (1 if a household is with dependent children, 0 otherwise). Among individual-level variables, we control for education level (primary and lower secondary; upper secondary and post-secondary non-tertiary education; and tertiary education levels) and age groups (0-19, 20-64 and 65+). We do not control for labor market status, since poverty is mostly determined by it.
We observe that, in all the countries, perceived exposure to noise or pollution is much higher in cities and towns compared to rural areas. However, in some countries the difference is huge. In Greece and Malta, almost half of the population that resides in cities and towns perceive exposure to noise or pollution (Figure 2). The share is also high in Portugal, France and Luxembourg. The difference is statistically significant in all countries.
Figure 2. Exposure to noise or pollution by settlement type, %
Source: Authors’ calculations based on 2023 EU-SILC (Eurostat, 2024).
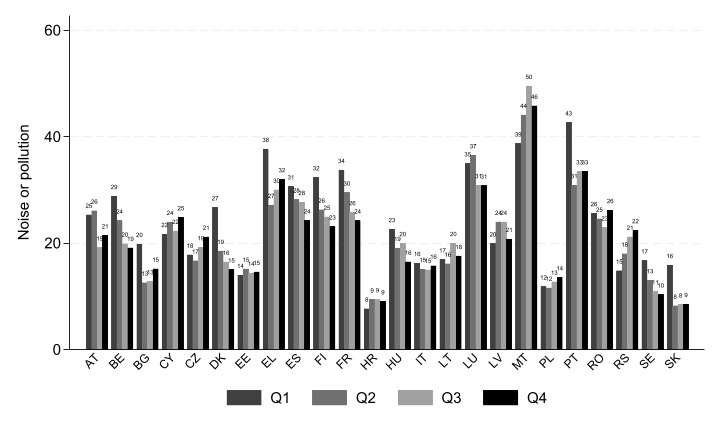
In the majority of EU countries, people at-risk-of-poverty perceive to be more exposed to noise or pollution, and the difference in proportion is statistically significant. In Serbia, poverty is much higher in rural areas, and residents in rural areas have lower perceived exposure to noise or pollution than in urban areas. That is why we observe higher perceived exposure to noise or pollution among non-poor households in Serbia. The same pattern is observed in several countries (Baltic countries, Romania, Bulgaria, Poland, etc.; see Figure 3), however, the difference is statistically significant only for Serbia, Croatia, and Lithuania (see Tables A1a and A1b in the Appendix). Additionally, we present in Appendix (Figure A1) perceived exposure to noise or pollution by equivalized disposable household income quartiles. The highest difference between the lowest income quartile (Q1) and the highest income quartile (Q4) is observed in Denmark; the difference amounts to 11.7 pp (26.7% perceive exposure in Q1 vs. 15% in Q4). Higher perceived exposure in the lowest income quartile compared with the highest income quartile is also observed in Belgium, Finland, France and Portugal, with the difference of 9 pp. In contrast, in Serbia, the share of perceived exposure amounted to 14.8% in Q1 and 22.4% in Q4. Malta also has a much higher share of perceived exposure in the top income quartile than in the bottom one. We do not observe any heterogeneity in the perceived exposure and income in Estonia. In the high-income EU countries (e.g., Scandinavian countries, Austria, France), the mechanism might be that non-poor individuals may have greater possibility to choose where to live and they opt to reside in quiet environments with fresh air. However, perceived exposure among lower-income groups depends on the spatial distribution of income and poverty.
Figure 3. Exposure to noise or pollution by poverty status, %
Source: Authors’ calculations based on 2023 EU-SILC (Eurostat, 2024).
In almost all countries, tenants are perceived to be, on average, more exposed to noise or pollution than homeowners. There is no statistically significant difference in the exposure by gender in almost all countries. Age group 20 to 64 is perceived to be on average, more exposed, and age group 65+ less exposed to the noise or pollution in the majority of countries, and the difference is statistically significant. There is no obvious pattern regarding perceived exposure to noise or pollution in relation to education level. Tables A1a and A1b in the Appendix present the mean difference in the perceived exposure to noise or pollution for the explanatory variables used in the analysis.
4 Empirical Methodology
We use a binary choice model to investigate the probability that an individual is exposed to the noise or pollution. Binary choice models are based on a latent regression model and a utility function. The model is defined as follows in the Equation 1:
Where is an unobserved latent variable, is a vector of explanatory variables, is the corresponding vector of parameters to be estimated, and is the error term. We observe a binary choice so that (Equation 2):
We estimate the probability of a positive outcome (i.e., ) and not observing the outcome (i.e., ) as follows (Equations 3 and 4):
Where stands for the cumulative distribution function. The normal distribution has been used in many empirical studies (, i.e., is the cumulative normal distribution function. Therefore, we opted for the probit estimation method.
Parameters estimated by probit, like for any nonlinear regression method, are not marginal effects. Marginal effects quantify the influence of any explanatory variable on the probability of a positive outcome, i.e., the probability of perceived exposure to the noise or pollution. The probability model is regression , and first derivative with respect to is the marginal effect calculated as ( stands for the probability density function). We present and interpret estimated marginal effects for selected variables. We also use logit for a robustness check. However, we do not present results for the marginal effects obtained from the logit estimation method since they are almost the same.3 Since both observables and unobservables can at the same time influence the probability of perceiving exposure to noise and to pollution, we use the bivariate probit method4 for robustness checks. Several partial effects can be evaluated after a model has been estimated by the bivariate probit method. We estimate marginal effects of explanatory variables on the two marginal probabilities and on the joint probability of being exposed to the noise and to the pollution (i.e., ).
5 Empirical Results
Marginal effects for all the explanatory variables and countries are presented in Appendix (Tables A2a and A2b), whereas Figure 4 presents the marginal effect for settlement type. We estimated marginal effects when settlement type is the only explanatory variable (i.e., unadjusted marginal effect) and when all explanatory variables are included (i.e., adjusted marginal effect). Settlement type has statistically significant influence on the probability to perceive exposure to the noise or pollution in all but one country. Living in a city, town or suburb increases the probability to perceive exposure to noise or pollution compared to living in rural areas, ceteris paribus. A similar conclusion was obtained by using 2013 EU-SILC data (Chiarini et al., 2020). The lowest statistically significant effect is observed for Slovakia, 2.3%. The effect is not significant only for Sweden. In Greece, living in a city increases the probability of the perceived exposure by 40% ceteris paribus. The effect is persistent, since the marginal effect for cities when it is the only explanatory variable, are similar to the marginal effect when we control for other observables. The relatively high level of the perceived exposure observed in Greece is also consistent with previous evidence highlighting road traffic and transport-related activities as important sources of environmental noise in major Greek urban areas, particularly Athens and Thessaloniki (Vlachokostas et al., 2012; Begou & Kassomenos, 2021).
Figure 4. Marginal effects of cities, towns and suburbs
Source: Authors’ calculations based on 2023 EU-SILC (Eurostat, 2024).
The second highest effect is observed in Malta; living in a city increases the perceived risk of exposure by 19.4%.5 The estimated marginal effect is the same if city is the only explanatory variable in the model. Therefore, residing in a city in Malta increases the probability of perceived exposure regardless other sociodemographic characteristics of the individual. In Bulgaria, Spain, France, Luxembourg, Romania and Serbia, the probability to perceive exposure to noise or pollution is higher in cities and towns than in rural areas by 14-15%. Estimated marginal effects for cities in other countries are smaller (below 10%).
The results are in line with the descriptive statistics regarding the influence of other explanatory variables (Tables A2a and A2b in Appendix). We observe that the older population (aged 65+) perceives less exposure to noise or pollution than the 20 to 64 age group, whereas there is no significant difference in the perception of the 20 to 64 population and those younger than 20. Being poor increases the probability of perceived exposure in Belgium, Bulgaria, Denmark, Greece, Spain, Finland, France, Portugal, Romania, Sweden and Slovakia, and decreases it in Latvia and Serbia. Therefore, our results are in line with the wide strand of literature suggesting that poor individuals tend to live in areas with higher exposures (Hoffmann et al., 2003; Hayward & Helbich, 2024; Drigo, 2024). However, our results for Latvia and Serbia confirm that the distribution of environmental burdens varies according to spatial, socioeconomic, and institutional factors, meaning that poorer individuals in some countries experience lower exposure to particular pollutants (Walker, 2012; Libertun de Duren et al., 2022). Being a homeowner reduces the probability of exposure in almost all countries, except for Cyprus. The highest marginal effect was observed in Finland (17.8%) and Portugal (15.5%). Living in a household with children reduces the probability of exposure compared to households without children in some countries. Gender and education level mostly do not have significant influence on the probability of exposure. Similar conclusions were obtained by Maione et al. (2021) that in several EU countries, education and gender explain the perception of air pollution causes only to a small extent.
Although our empirical analysis does not directly test the structural, spatial, or institutional mechanisms that may underlie the observed cross country differences, several plausible explanations emerge from previous empirical research. Countries with dense urban morphology, high transport intensity, and limited separation between residential and traffic corridors, such as Greece, Malta, Spain, and France, tend to exhibit stronger urban–rural contrasts. Compact Mediterranean cities are characterized by narrow street networks, high building density, and intense road traffic, all of which amplify everyday exposure to noise and pollution and increase the salience of environmental stressors (Lercher, 1996; Vlachokostas et al., 2012; Begou & Kassomenos, 2021; Foraster et al., 2022). In contrast, weaker marginal effects in Slovakia, Finland, and the Baltic countries may reflect more balanced settlement patterns, lower residential density, and greater availability of green infrastructure, which mitigate exposure and reduce subjective environmental burden (Markevych et al., 2017; Dzhambov et al., 2019). Divergent results in Serbia and Latvia correspond to the spatial distribution of poverty: in the contexts where poverty is predominantly rural, low income households often reside in less urbanized areas with lower environmental pressures, producing an inverse pattern relative to Western Europe (Walker, 2012; Banzhaf et al., 2019; World Bank, 2025). Residential segregation and housing structures may also contribute to cross country variation. Studies show that multi story apartment buildings located near major transport corridors amplify perceived noise and pollution (Havard et al., 2011; Cesaroni et al., 2010), whereas detached housing in rural or peri urban areas provides greater physical distance from environmental stressors (Evans & Kantrowitz, 2002). Differences in national environmental policies, enforcement capacity, and investment in transport infrastructure may further shape subjective exposure, as countries with stricter noise regulation, better insulation standards, or more effective traffic management often report lower perceived environmental burdens (European Environment Agency, 2024; World Health Organization Regional Office for Europe, 2025). Taken together, these mechanisms, although not empirically tested within our model, offer plausible contextual explanations for the heterogeneous patterns of subjective environmental exposure observed across Europe.
6 Robustness Check
We did several robustness checks in order to investigate the sensitivity of our results. Firstly, we investigated the influence of cities, and towns and suburbs separately, compared with rural areas, on the probability of perceived exposure (Figure 5). Residing in a city compared with rural areas has a statistically significant positive influence on the probability of perceived exposure. Residing in towns and suburbs also has a statistically significant effect on the perceived exposure, but not in all countries. The marginal effect for towns and suburbs is lower than for cities, as expected. The effect is not significant in Slovakia, Sweden, Finland, Denmark, Cyprus, and Belgium. Greece has the highest marginal effect, both for cities and towns and suburbs compared to rural areas. Residing in a Greek city increases the probability of exposure to almost 50%, and in towns and suburbs to 30%. Similar results were observed by Chiarini et al. (2020) for 2013. They found the lowest effect in Scandinavian countries, and the highest effect in Greece.
Figure 5. Marginal effects of cities, and towns and suburbs
Notes: We exclude Estonia and Latvia, since the variable degree of urbanization has merged data on cities, towns and suburbs. Source: Authors’ calculations based on 2023 EU-SILC (Eurostat, 2024).
Secondly, as our final robustness check, we estimate the model with the bivariate probit method in order to estimate two equations jointly: the probability of being exposed to noise and the probability of being exposed to pollution. The same methodology was applied by Chiarini et al. (2020). In all countries, the correlation between the equations (one for exposure to noise and one for exposure to pollution) is statistically significant, suggesting that unobservables influence at the same time the probability of being exposed to noise and of being exposed to pollution as expected. Marginal effects for cities are statistically significant for most of the countries in both equations. The highest marginal effects are observed in Greece. Living in cities increases both marginal probabilities, to perceive exposure to noise and to perceive exposure to pollution by more than 30%, respectively. In a few countries, residing in cities influences the marginal probabilities of one perceived exposure only, either noise or pollution. Living in cities increases the probability of perceived exposure to noise only (and not to pollution) in Austria, Cyprus, Denmark and Slovakia. The marginal effect of cities on pollution only (and not on the noise) is significant in Malta and Sweden. In Malta, living in cities increases the probability of being exposed to pollution by 34%. Marginal effects of cities on two marginal probabilities are presented in Figure 6. Figure 7 presents marginal effects of cities on the joint probability of being exposed to noise and pollution. Living in a city in Greece increases the probability of the perceived exposure to both environmental risks by 21.7%. Malta also has a very high marginal effect, 16.5%. The results for marginal effects for other explanatory variables are available upon request.
Figure 6. Marginal effect on marginal probability of the perceived exposure
Source: Authors’ calculations based on 2023 EU-SILC (Eurostat, 2024).
Figure 7. Marginal effect on joint probability of perceived exposure
Source: Authors’ calculations based on 2023 EU-SILC (Eurostat, 2024).
7 Conclusions
This study provides comparative insights into the factors shaping subjective exposure to noise and pollution across European countries. We use harmonized 2023 EU SILC microdata to estimate the probability of perceiving exposure to noise or pollution by using a wide set of individual and household characteristics. The results clearly demonstrate that the degree of urbanization is the strongest and most consistent predictor of perceived environmental risks: individuals living in cities, towns, or suburban areas have a significantly higher probability of reporting exposure compared to those residing in rural areas. This pattern confirms the central role of urban environments as focal points of environmental stressors, reflecting both objectively higher concentrations of pollutants and the subjective burden of everyday urban living.
Sociodemographic characteristics further influence perceptions of exposure. Older individuals report environmental problems less frequently, which may reflect adaptation processes, longer residence in the same environment, or lower likelihood of living in densely populated urban zones. Homeowners are less likely to report exposure than tenants, supporting the hypothesis of residential self selection, whereby individuals with greater resources choose to live in areas with fewer environmental burdens. Poverty increases exposure in most countries, consistent with the environmental inequality literature, while exceptions such as Serbia and Latvia highlight the importance of national spatial patterns of poverty. Our findings are in line with previous research that lower income and socioeconomic status are associated with higher exposure to noise.
Additional analyses confirm the robustness of these findings: residing in cities, towns, or suburbs increases perceived exposure, although to varying degrees, and the results from the bivariate probit method show that unobserved factors simultaneously influence perceptions of noise and pollution, underscoring their interconnected nature. These results indicate that subjective environmental exposure is a complex phenomenon shaped by the interplay of physical, social, and psychological factors. In the broader context of sustainable development, the findings underscore the need for integrated policies that address environmental pressures, social inequalities, and spatial patterns of settlement simultaneously. Reducing noise and pollution in urban areas must be a core component of sustainable urban development strategies, including improvements in public transport, reductions in traffic intensity, expansion of green spaces, and more effective urban planning. At the same time, reducing social inequalities and improving access to adequate housing are essential for achieving equitable and sustainable development, as environmental risks disproportionately affect vulnerable groups. Encouraging a more balanced spatial distribution of the population and strengthening rural areas can help relieve pressure on urban environments and reduce overall environmental burdens.
Finally, our findings should be interpreted primarily as correlational rather than causal. While the estimated marginal effects identify systematic differences in the probability of the perceived exposure to noise or pollution conditional on the observed individual and household characteristics, the cross-sectional observational design does not allow us to rule out unobserved factors or other sources of endogeneity that may contribute to the observed relationships. Further research using longitudinal data and alternative identification strategies (panel or instrumental variables) is necessary to investigate the causal mechanisms underlying the observed relationships between residential location, socioeconomic characteristics, and the perceived exposure to environmental risks. However, our study contributes to the literature by identifying the key individual, household, and residential determinants of the self-reported exposure to noise or pollution in a comparative setting. By offering a comprehensive cross country comparison based on harmonized EU-SILC data, this study fills an important gap in the literature and provides empirical insights that can support the development of sustainable policies aimed at improving the quality of life and fostering healthier, more equitable, and more resilient communities across Europe.
This research was supported by the Science Fund of the Republic of Serbia, Grant no. 7358, Population dynamics under environmental challenges in Serbia – POPENVIROS.
Data availability statement
The data used in this study are derived from the European Union Statistics on Income and Living Conditions (EU-SILC). Access to these microdata is subject to the data access and confidentiality rules established by Eurostat. The authors are not authorised to share the underlying microdata publicly or with third parties. Information on accessing EU-SILC data is available from Eurostat.
References
- Banzhaf, H. S., & Walsh, R. P. (2008). Do people vote with their feet? An empirical test of Tiebout’s mechanism. American Economic Review, 98(3), 843-863. https://doi.org/10.1257/aer.98.3.843
- Banzhaf, S., Ma, L., & Timmins, C. (2019). Environmental justice: The economics of race, place, and pollution. Journal of Economic Perspectives, 33(1), 185-208. https://doi.org/10.1257/jep.33.1.185
- Begou, P., & Kassomenos, P. (2021). Exposure to the road traffic noise in an urban complex in Greece: The quantification of healthy life years lost due to noise-induced annoyance and noise-induced sleep disturbances. Environmental Science and Pollution Research, 28(10), 12932-12943. https://doi.org/10.1007/s11356-020-11190-4
- Betti, G., Neri, L., Lonzi, M., & Lemmi, A. (2020). Objective Environmental Indicators and Subjective Well-Being: Are They Directly Related?. Sustainability, 12(6), 2277. https://doi.org/10.3390/su12062277
- Bickerstaff, K., & Walker, G. (2001). Public understandings of air pollution: The "localisation" of environmental risk. Global Environmental Change, 11(2), 133-145. https://doi.org/10.1016/S0959-3780(00)00063-7
- Burnett, R., Chen, H., Szyszkowicz, M., Fann, N., Hubbell, B., Pope, C. A., Apte, J. S., Brauer, M., Cohen, A., Weichenthal, S., Coggins, J., Di, Q., Brunekreef, B., Frostad, J., Lim, S. S., Kan, H., Walker, K. D., Thurston, G. D., Hayes, R. B., Lim, C. C., Turner, M. C., Jerrett, M., Krewski, D., Gapstur, S. M., Diver, W. R., Ostro, B., Goldberg, D., Crouse, D. L., Martin, R. V., Peters, P., Pinault, L., Tjepkema, M., van Donkelaar, A., Villeneuve, P. J., Miller, A. B., Yin, P., Zhou, M., Wang, L., Janssen, N. A. H., Marra, M., Atkinson, R. W., Tsang, H., Quoc Thach, T., Cannon, J. B., Allen, R. T., Hart, J. E., Laden, F., Cesaroni, G., Forastiere, F., Weinmayr, G., Jaensch, A., Nagel, G., Concin, H., & Spadaro, J. V. (2018). Global estimates of mortality associated with long-term exposure to outdoor fine particulate matter. Proceedings of the National Academy of Sciences, 115(38), 9592-9597. https://doi.org/10.1073/pnas.1803222115
- Cesaroni, G., Badaloni, C., Romano, V., Donato, E., Perucci, C. A., & Forastiere, F. (2010). Socioeconomic position and health status of people who live near busy roads: The Rome Longitudinal Study (RoLS). Environmental Health, 9(1), 41. https://doi.org/10.1186/1476-069x-9-41
- Chiarini, B., D’Agostino, A., Marzano, E., & Regoli, A. (2020). The perception of air pollution and noise in urban environments: A subjective indicator across European countries. Journal of Environmental Management, 263, 110272. https://doi.org/10.1016/j.jenvman.2020.110272
- Drigo, A. (2024). Breathing inequality? Income, ethnicity and PM2.5 exposure in Bologna, Italy (Working Paper No. 24.2024). Fondazione Eni Enrico Mattei. https://hdl.handle.net/10419/306775
- Dzhambov, A. M., Hartig, T., Tilov, B., Atanasova, V., Makakova, D. R., & Dimitrova, D. D. (2019). Residential greenspace is associated with mental health via intertwined capacity-building and capacity-restoring pathways. Environmental Research, 178, 108708. https://doi.org/10.1016/j.envres.2019.108708
- European Environment Agency. (2024). Harm to human health from air pollution in Europe: Burden of disease status (Briefing No. 21/2024). Publications Office of the European Union. https://doi.org/10.2800/3950756
- European Environment Agency. (2025). Environmental noise in Europe 2025 (EEA Report 05/2025). Publications Office of the European Union. https://doi.org/10.2800/5134480
- Eurostat. (2024). European Union Statistics on Income and Living Conditions (EU-SILC) microdata, 2024 release: Data covering 2004–2023 [Data set]. https://doi.org/10.2907/EUSILC2004-2023
- Evans, G. W. (2003). The Built Environment and Mental Health. J Urban Health, 80, 536-555. https://doi.org/10.1093/jurban/jtg063
- Evans, G. W., & Kantrowitz, E. (2002). Socioeconomic status and health: The potential role of environmental risk exposure. Annual Review of Public Health, 23(1), 303-331. https://doi.org/10.1146/annurev.publhealth.23.112001.112349
- Foraster, M., Esnaola, M., López-Vicente, M., Rivas, I., Álvarez-Pedrerol, M., Persavento, C., Sebastian-Galles, N., Pujol, J., Dadvand, P., & Sunyer, J. (2022). Exposure to road traffic noise and cognitive development in schoolchildren in Barcelona, Spain: A population-based cohort study. PLOS Medicine, 19(6), e1004001. https://doi.org/10.1371/journal.pmed.1004001
- Greene, W. H. (2020). Econometric analysis (8th global ed.). Pearson. https://api.pageplace.de/preview/DT0400.9781292231150_A39514649/preview-9781292231150_A39514649.pdf
- Havard, S., Reich, B. J., Bean, K., & Chaix, B. (2011). Social inequalities in residential exposure to road traffic noise: An environmental justice analysis based on the RECORD Cohort Study. Occupational and Environmental Medicine, 68(5), 366-374. https://doi.org/10.1136/oem.2010.060640
- Hayward, M., & Helbich, M. (2024). Environmental noise is positively associated with socioeconomically less privileged neighborhoods in the Netherlands. Environmental Research, 248, 118294. https://doi.org/10.1016/j.envres.2024.118294
- Herrera, C., & Cabrera-Barona, P. (2022). Impact of perceptions of air pollution and noise on subjective well-being and health. Earth, 3(3), 825-838. https://doi.org/10.3390/earth3030047
- Analysing Malta’s implementation of Directive 2002/49/EC on the assessment and management of environmental noise. European Parliament (2026). https://www.europarl.europa.eu/thinktank/en/document/IUST_STU(2026)783089
- Hoffmann, B., Robra, B. P., & Swart, E. (2003). Soziale Ungleichheit und Strassenlärm im Wohnumfeld-eine Auswertung des Bundesgesundheitssurveys. Das Gesundheitswesen, 65(06), 393-401. https://doi.org/10.1055/s-2003-40308
- Lelieveld, J., Klingmüller, K., Pozzer, A., Burnett, R. T., Haines, A., & Ramanathan, V. (2019). Effects of fossil fuel and total anthropogenic emission removal on public health and climate. Proceedings of the National Academy of Sciences, 116(15), 7192-7197. https://doi.org/10.1073/pnas.1819989116
- Lercher, P. (1996). Environmental noise and health: An integrated research perspective. Environment International, 22(1), 117-129. https://doi.org/10.1016/0160-4120(95)00109-3
- Libertun de Duren, N. R., López Benítez, B., Bonilla, J. P., Regalia, F., Bilal, U., Ibáñez, A. M., Schady, N., Chauvin, J. P., Pinillos, J., Hoffmann, B., Medina, M. P., Blackman, A., Savedoff, W. D., Slesinski, C., Cortínez-O’Ryan, A., Indvik, K., Mazariego, M., Morais, L. M. de O., Vidaña-Pérez, D., Rubinstein, A., Cejas, C., Corburn, J., Pérez-Jaramillo, J., & Martinez-Herrera, E. (2022). Inclusive Cities: Healthy Cities for All (N. R. Libertun de Duren, Ed.). Inter-American Development Bank. https://doi.org/10.18235/0004459
- Maione, M., Mocca, E., Eisfeld, K., Kazepov, Y., & Fuzzi, S. (2021). Public perception of air pollution sources across Europe. Ambio, 50(6), 1150-1158. https://doi.org/10.1007/s13280-020-01450-5
- Markevych, I., Schoierer, J., Hartig, T., Chudnovsky, A., Hystad, P., Dzhambov, A. M., de Vries, S., Triguero-Mas, M., Brauer, M., Nieuwenhuijsen, M. J., Lupp, G., Richardson, E. A., Astell-Burt, T., Dimitrova, D., Feng, X., Sadeh, M., Standl, M., Heinrich, J., & Fuertes, E. (2017). Exploring pathways linking greenspace to health: Theoretical and methodological guidance. Environmental Research, 158, 301-317. https://doi.org/10.1016/j.envres.2017.06.028
- Miedema, H. M. E., & Vos, H. (1999). Demographic and attitudinal factors that modify annoyance from transportation noise. The Journal of the Acoustical Society of America, 105(6), 3336-3344. https://doi.org/10.1121/1.424662
- United Nations. (2025). World Urbanization Prospects 2025: Summary of Results (UN DESA/POP/2025/TR/ NO. 12). https://doi.org/10.18356/9789211576788
- Vlachokostas, C., Achillas, C., Michailidou, A. V., & Moussiopoulos Ν. (2012). Measuring combined exposure to environmental pressures in urban areas: An air quality and noise pollution assessment approach. Environment International, 39(1), 8-18. https://doi.org/10.1016/j.envint.2011.09.007
- Walker, G. (2012). Environmental Justice: Concepts, Evidence and Politics. Routledge. https://doi.org/10.4324/9780203610671
- Wooldridge, J. M. (2010). Econometric analysis of cross section and panel data (2nd ed.). MIT Press. https://ipcid.org/evaluation/apoio/Wooldridge%20-%20Cross-section%20and%20Panel%20Data.pdf
- World Bank. (2025). World Development Report 2025: Standards for Development. https://doi.org/10.1596/978-1-4648-2275-9
- World Health Organization. (2024). How much does environmental noise affect our health? WHO updates methods to assess health risks [News release]. https://www.who.int/europe/news/item/04-08-2024-how-much-does-environmental-noise-affect-our-health--who-updates-methods-to-assess-health-risks
- World Health Organization Regional Office for Europe. (2025). Health risks of air pollution in Europe: HRAPIE-2 project: Updated guidance on concentration-response functions for health risk assessment of air pollution in the WHO European Region. https://www.who.int/europe/publications/i/item/9789289062633
Footnotes
- The World Health Organization divides its member states into six distinct geographic regions. European Region comprises 53 countries, covering a vast geographical region from the Atlantic to the Pacific oceans.
- The exclusion of Germany, Ireland, Slovenia, and the Netherlands may limit the representativeness of our results for the EU as a whole. Since our models are estimated separately by country, however, their exclusion does not affect the internal validity of the country-specific estimates; rather, it limits the generalizability of the cross-country evidence.
- For references see e.g., Greene (2020) or Wooldridge (2010).
- We do not formulate model. Bivariate probit method is presented in many econometrics’ textbooks, for example see Greene (2020).
- This result for Malta should be taken with some caution, since almost all the population of Malta lives in urban areas. Total sample size for Malta amounts to 9,565 observations and the model can be estimated reliably with probit although a highly unbalanced distribution of the dependent variable is observed. For robustness check, we applied complementary log-log method which is used when one outcome is rare. The marginal effect for cities amounted to 0.211 vs. 0.194 in probit, and the confidence intervals overlap, meaning that there is no significant difference between the estimates by probit and complementary log-log. The results are available upon request.
APPENDIX
Figure A1. Exposure to noise or pollution by income quartile, %
| Variable | AT | BE | BG | CY | CZ | DK | EE | EL | ES | FI | FR | HR |
|---|---|---|---|---|---|---|---|---|---|---|---|---|
| Male-Female | -0.021* | -0.008 | 0.002 | -0.006 | -0.005 | 0.003 | -0.012 | -0.005 | -0.003 | -0.013* | -0.017*** | -0.007 |
| Tenant-Homeowner | 0.102*** | 0.101*** | 0.113*** | -0.032* | 0.069*** | 0.156*** | 0.024 | 0.161*** | 0.078*** | 0.234*** | 0.160*** | 0.042* |
| Non-poor- Poor | -0.040** | -0.109*** | -0.047*** | 0.014 | -0.017 | -0.088*** | 0.017 | -0.045*** | -0.042*** | -0.129*** | -0.103*** | 0.012* |
| hh. without ch. – hh. with ch. | 0.025** | -0.015 | -0.035*** | 0.012 | -0.009 | 0.024** | 0.001 | -0.075*** | 0.002 | 0.036*** | -0.012* | 0.009* |
| Others-Lower education level | -0.003 | -0.078*** | -0.063*** | -0.004 | 0.005 | 0.015 | 0.015 | 0.122*** | 0.006 | 0.039*** | -0.021*** | 0.020*** |
| Others-Secondary education level | 0.004 | 0.017* | 0.048*** | 0.004 | 0.021** | -0.008 | -0.002 | -0.064*** | -0.006 | -0.011 | 0.008 | -0.007 |
| Others-Tertiary education level | -0.002 | 0.040*** | -0.002 | -0.001 | -0.032*** | -0.002 | -0.008 | -0.079*** | -0.001 | -0.011 | 0.010 | -0.013* |
| Other_age – age<=19 | -0.000 | -0.018 | -0.046** | 0.016 | 0.008 | 0.046* | -0.006 | -0.064*** | 0.008 | 0.025* | -0.007 | 0.006 |
| Other_age – age 20-64 | -0.031*** | -0.052*** | -0.020*** | -0.016 | -0.029*** | -0.093*** | -0.014 | -0.067*** | -0.040*** | -0.066*** | -0.037*** | 0.005 |
| Other_age – age >=65 | 0.034*** | 0.062*** | 0.027*** | 0.014 | 0.029*** | 0.088*** | 0.017* | 0.078*** | 0.043*** | 0.068*** | 0.043*** | -0.006 |
| Rural areas – cities and towns | -0.089*** | -0.095*** | -0.100*** | -0.054*** | -0.082*** | -0.060*** | -0.031*** | -0.310*** | -0.134*** | -0.095*** | -0.154*** | -0.038*** |
|
Notes: ***, ** and * denote, respectively, statistical significance at the 0.01, 0.05 and 0.1 levels using two-tailed tests.
Source: Authors’ calculations based on 2023 EU-SILC (Eurostat, 2024). |
||||||||||||
| Variable | HU | IT | LT | LU | LV | MT | PL | PT | RO | RS | SE | SK |
|---|---|---|---|---|---|---|---|---|---|---|---|---|
| Male-Female | -0.004 | -0.006 | -0.004 | -0.001 | -0.015 | -0.010 | -0.007 | -0.009 | -0.005 | -0.016* | -0.012* | -0.002 |
| Tenant-Homeowner | 0.096*** | 0.033*** | 0.064** | 0.029* | 0.052*** | 0.054*** | 0.103*** | 0.134*** | 0.029 | 0.138*** | 0.121*** | 0.123*** |
| Non-poor- Poor | -0.039*** | -0.009* | 0.021* | -0.019 | 0.010 | 0.001 | 0.009 | -0.011 | 0.017 | 0.033*** | -0.075*** | -0.079*** |
| hh. without ch. – hh. with ch. | -0.009 | 0.006 | -0.012 | 0.029** | -0.007 | -0.031** | 0.017*** | -0.013* | 0.000 | 0.016* | 0.008 | -0.021*** |
| Others-Lower education level | -0.015* | 0.010** | 0.023* | 0.014 | 0.014 | 0.060*** | 0.021*** | 0.020*** | 0.034*** | 0.046*** | -0.001 | -0.106*** |
| Others-Secondary education level | 0.014* | 0.010** | 0.026*** | -0.007 | -0.001 | -0.050*** | 0.002 | -0.007 | -0.002 | -0.005 | -0.001 | 0.036*** |
| Others-Tertiary education level | -0.005 | -0.032*** | -0.038*** | -0.002 | -0.007 | -0.028* | -0.015*** | -0.023*** | -0.057*** | -0.054*** | 0.001 | 0.024*** |
| Other_age – age<=19 | -0.004 | 0.017* | -0.019 | 0.058 | 0.012 | 0.047* | 0.003 | -0.002 | -0.021 | 0.019 | -0.002 | -0.035* |
| Other_age – age 20-64 | -0.016* | -0.006* | -0.038*** | -0.040** | -0.038*** | -0.023* | 0.002 | -0.025*** | 0.006 | -0.007 | -0.047*** | -0.002 |
| Other_age – age >=65 | 0.017** | 0.004 | 0.042*** | 0.034** | 0.038*** | 0.011 | -0.002 | 0.027*** | -0.003 | 0.004 | 0.057*** | 0.008 |
| Rural areas – cities and towns | -0.046*** | -0.091*** | -0.081*** | -0.101*** | -0.110*** | -0.232*** | -0.072*** | -0.114*** | -0.126*** | -0.145*** | -0.025*** | -0.027*** |
|
Notes: ***, ** and * denote, respectively, statistical significance at the 0.01, 0.05 and 0.1 levels using two-tailed tests.
Source: Authors’ calculations based on 2023 EU-SILC (Eurostat, 2024). |
||||||||||||
| Variable | AT | BE | BG | CY | CZ | DK | EE | EL | ES | FI | FR | HR |
|---|---|---|---|---|---|---|---|---|---|---|---|---|
| Cities | 0.057*** | 0.072*** | 0.142*** | 0.052*** | 0.085*** | 0.041*** | 0.033*** | 0.403*** | 0.143*** | 0.050*** | 0.152*** | 0.042*** |
| (0.011) | (0.014) | (0.008) | (0.014) | (0.008) | (0.010) | (0.009) | (0.009) | (0.008) | (0.011) | (0.006) | (0.006) | |
| Age <=19 | 0.025 | -0.024 | 0.022 | -0.061** | -0.005 | -0.038 | 0.036 | 0.014 | -0.015 | 0.013 | -0.014 | -0.002 |
| (0.029) | (0.023) | (0.018) | (0.029) | (0.022) | (0.029) | (0.023) | (0.019) | (0.012) | (0.024) | (0.013) | (0.014) | |
| Age>=65 | -0.039*** | -0.076*** | -0.023*** | -0.040*** | -0.037*** | -0.114*** | -0.022* | -0.015* | -0.043*** | -0.095*** | -0.036*** | 0.011* |
| (0.013) | (0.012) | (0.008) | (0.015) | (0.009) | (0.011) | (0.011) | (0.009) | (0.007) | (0.013) | (0.008) | (0.006) | |
| Female | 0.022** | 0.005 | -0.003 | 0.009 | 0.001 | -0.008 | 0.012 | 0.004 | 0.006 | 0.009 | 0.012** | 0.006 |
| (0.010) | (0.009) | (0.007) | (0.011) | (0.007) | (0.009) | (0.009) | (0.007) | (0.005) | (0.010) | (0.006) | (0.006) | |
| Poor | -0.014 | 0.039*** | 0.036*** | -0.008 | 0.007 | 0.048*** | -0.016 | 0.091*** | 0.043*** | 0.038** | 0.032*** | -0.009 |
| (0.016) | (0.014) | (0.009) | (0.018) | (0.013) | (0.015) | (0.011) | (0.009) | (0.007) | (0.018) | (0.009) | (0.007) | |
| Low education | -0.002 | 0.068*** | 0.100*** | 0.020 | 0.002 | -0.004 | -0.013 | -0.027*** | -0.002 | -0.010 | 0.001 | -0.015** |
| (0.016) | (0.013) | (0.009) | (0.016) | (0.014) | (0.014) | (0.015) | (0.009) | (0.007) | (0.016) | (0.008) | (0.007) | |
| High education | -0.006 | -0.001 | 0.017* | 0.013 | 0.017* | 0.005 | 0.001 | -0.005 | 0.006 | 0.016 | -0.012* | -0.000 |
| (0.011) | (0.011) | (0.009) | (0.014) | (0.009) | (0.011) | (0.010) | (0.009) | (0.007) | (0.011) | (0.007) | (0.007) | |
| HH with children | -0.026** | -0.029*** | 0.017** | -0.024* | -0.011 | -0.041*** | -0.016 | 0.012 | -0.027*** | -0.056*** | -0.003 | -0.016** |
| (0.012) | (0.011) | (0.008) | (0.013) | (0.009) | (0.012) | (0.011) | (0.009) | (0.006) | (0.011) | (0.007) | (0.007) | |
| Tenure | -0.059*** | -0.056*** | -0.057*** | 0.065*** | -0.053*** | -0.134*** | -0.023 | -0.066*** | -0.051*** | -0.178*** | -0.107*** | -0.030 |
| (0.011) | (0.011) | (0.019) | (0.019) | (0.010) | (0.010) | (0.017) | (0.010) | (0.008) | (0.012) | (0.007) | (0.020) | |
| N | 10,493 | 11,607 | 16,029 | 8,984 | 15,180 | 10,032 | 9,563 | 20,177 | 56,099 | 16,793 | 30,360 | 18,076 |
|
Notes: Standard errors are reported in parentheses under the estimates. ***, ** and * denote, respectively, statistical significance at the 0.01, 0.05 and 0.1 levels using two-tailed tests.
Source: Authors’ calculations based on 2023 EU-SILC (Eurostat, 2024). |
||||||||||||
| Variable | HU | IT | LT | LU | LV | MT | PL | PT | RO | RS | SE | SK |
|---|---|---|---|---|---|---|---|---|---|---|---|---|
| Cities | 0.063*** | 0.097*** | 0.098*** | 0.156*** | 0.118*** | 0.194*** | 0.076*** | 0.102*** | 0.142*** | 0.156*** | 0.011 | 0.023*** |
| (0.008) | (0.010) | (0.011) | (0.016) | (0.010) | (0.055) | (0.006) | (0.012) | (0.010) | (0.009) | (0.009) | (0.008) | |
| Age <=19 | -0.023 | -0.035** | 0.002 | -0.017 | -0.034 | -0.071* | 0.022 | -0.023 | 0.047* | -0.020 | 0.008 | -0.053** |
| (0.018) | (0.018) | (0.031) | (0.054) | (0.028) | (0.039) | (0.017) | (0.026) | (0.026) | (0.023) | (0.014) | (0.026) | |
| Age>=65 | -0.011 | -0.008 | -0.069*** | -0.039** | -0.039*** | 0.002 | -0.015** | -0.022* | 0.012 | -0.003 | -0.082*** | -0.019* |
| (0.009) | (0.008) | (0.013) | (0.019) | (0.012) | (0.022) | (0.006) | (0.012) | (0.010) | (0.010) | (0.009) | (0.011) | |
| Female | 0.002 | 0.000 | 0.009 | 0.009 | 0.022** | 0.004 | 0.005 | 0.009 | 0.004 | 0.014 | 0.014** | 0.003 |
| (0.007) | (0.006) | (0.011) | (0.016) | (0.010) | (0.018) | (0.005) | (0.010) | (0.009) | (0.009) | (0.006) | (0.008) | |
| Poor | 0.054*** | 0.008 | 0.012 | 0.015 | -0.020* | -0.036 | 0.006 | 0.051*** | 0.033** | -0.036*** | 0.024** | 0.048*** |
| (0.011) | (0.009) | (0.014) | (0.025) | (0.012) | (0.026) | (0.007) | (0.014) | (0.013) | (0.011) | (0.010) | (0.011) | |
| Low education | 0.013 | 0.002 | 0.007 | 0.015 | -0.003 | -0.084*** | -0.013 | 0.007 | 0.001 | -0.008 | -0.015 | 0.101*** |
| (0.010) | (0.008) | (0.022) | (0.024) | (0.017) | (0.022) | (0.009) | (0.013) | (0.013) | (0.012) | (0.010) | (0.015) | |
| High education | 0.002 | 0.024*** | 0.030** | -0.023 | -0.020* | -0.029 | 0.002 | 0.017 | 0.021 | 0.004 | 0.004 | 0.000 |
| (0.009) | (0.008) | (0.012) | (0.017) | (0.011) | (0.026) | (0.006) | (0.014) | (0.014) | (0.011) | (0.007) | (0.010) | |
| HH with ch | -0.010 | 0.007 | -0.017 | -0.023 | -0.002 | 0.023 | -0.031*** | -0.003 | 0.017 | -0.012 | -0.033*** | -0.002 |
| (0.009) | (0.008) | (0.013) | (0.018) | (0.011) | (0.022) | (0.006) | (0.012) | (0.011) | (0.010) | (0.007) | (0.009) | |
| Tenure | -0.066*** | -0.016* | -0.081*** | 0.012 | -0.039** | -0.041 | -0.058*** | -0.155*** | 0.038 | -0.046* | -0.107*** | -0.047*** |
| (0.014) | (0.009) | (0.031) | (0.018) | (0.015) | (0.026) | (0.011) | (0.015) | (0.034) | (0.028) | (0.007) | (0.013) | |
| N | 15,699 | 52,238 | 10,543 | 7,726 | 9,415 | 9,565 | 30,483 | 29,950 | 15,585 | 13,848 | 17,352 | 11,847 |
|
Notes: Standard errors are reported in parentheses under the estimates. ***, ** and * denote, respectively, statistical significance at the 0.01, 0.05 and 0.1 levels using two-tailed tests.
Source: Authors’ calculations based on 2023 EU-SILC (Eurostat, 2024). |
||||||||||||
Article Details
Published by the Institute of Social Sciences - Center for Demographic Research




References
Banzhaf, S., Ma, L., & Timmins, C. (2019). Environmental justice: The economics of race, place, and pollution. Journal of Economic Perspectives, 33(1), 185-208. https://doi.org/10.1257/jep.33.1.185
Begou, P., & Kassomenos, P. (2021). Exposure to the road traffic noise in an urban complex in Greece: The quantification of healthy life years lost due to noise-induced annoyance and noise-induced sleep disturbances. Environmental Science and Pollution Research, 28(10), 12932-12943. https://doi.org/10.1007/s11356-020-11190-4
Betti, G., Neri, L., Lonzi, M., & Lemmi, A. (2020). Objective Environmental Indicators and Subjective Well-Being: Are They Directly Related?. Sustainability, 12(6), 2277. https://doi.org/10.3390/su12062277
Bickerstaff, K., & Walker, G. (2001). Public understandings of air pollution: The "localisation" of environmental risk. Global Environmental Change, 11(2), 133-145. https://doi.org/10.1016/S0959-3780(00)00063-7
Burnett, R., Chen, H., Szyszkowicz, M., Fann, N., Hubbell, B., Pope, C. A., Apte, J. S., Brauer, M., Cohen, A., Weichenthal, S., Coggins, J., Di, Q., Brunekreef, B., Frostad, J., Lim, S. S., Kan, H., Walker, K. D., Thurston, G. D., Hayes, R. B., Lim, C. C., Turner, M. C., Jerrett, M., Krewski, D., Gapstur, S. M., Diver, W. R., Ostro, B., Goldberg, D., Crouse, D. L., Martin, R. V., Peters, P., Pinault, L., Tjepkema, M., van Donkelaar, A., Villeneuve, P. J., Miller, A. B., Yin, P., Zhou, M., Wang, L., Janssen, N. A. H., Marra, M., Atkinson, R. W., Tsang, H., Quoc Thach, T., Cannon, J. B., Allen, R. T., Hart, J. E., Laden, F., Cesaroni, G., Forastiere, F., Weinmayr, G., Jaensch, A., Nagel, G., Concin, H., & Spadaro, J. V. (2018). Global estimates of mortality associated with long-term exposure to outdoor fine particulate matter. Proceedings of the National Academy of Sciences, 115(38), 9592-9597. https://doi.org/10.1073/pnas.1803222115
Cesaroni, G., Badaloni, C., Romano, V., Donato, E., Perucci, C. A., & Forastiere, F. (2010). Socioeconomic position and health status of people who live near busy roads: The Rome Longitudinal Study (RoLS). Environmental Health, 9(1), 41. https://doi.org/10.1186/1476-069x-9-41
Chiarini, B., D’Agostino, A., Marzano, E., & Regoli, A. (2020). The perception of air pollution and noise in urban environments: A subjective indicator across European countries. Journal of Environmental Management, 263, 110272. https://doi.org/10.1016/j.jenvman.2020.110272
Drigo, A. (2024). Breathing inequality? Income, ethnicity and PM2.5 exposure in Bologna, Italy (Working Paper No. 24.2024). Fondazione Eni Enrico Mattei. https://hdl.handle.net/10419/306775
Dzhambov, A. M., Hartig, T., Tilov, B., Atanasova, V., Makakova, D. R., & Dimitrova, D. D. (2019). Residential greenspace is associated with mental health via intertwined capacity-building and capacity-restoring pathways. Environmental Research, 178, 108708. https://doi.org/10.1016/j.envres.2019.108708
European Environment Agency. (2024). Harm to human health from air pollution in Europe: Burden of disease status (Briefing No. 21/2024). Publications Office of the European Union. https://doi.org/10.2800/3950756
European Environment Agency. (2025). Environmental noise in Europe 2025 (EEA Report 05/2025). Publications Office of the European Union. https://doi.org/10.2800/5134480
Eurostat. (2024). European Union Statistics on Income and Living Conditions (EU-SILC) microdata, 2024 release: Data covering 2004–2023 [Data set]. https://doi.org/10.2907/EUSILC2004-2023
Evans, G. W. (2003). The Built Environment and Mental Health. J Urban Health, 80, 536-555. https://doi.org/10.1093/jurban/jtg063
Evans, G. W., & Kantrowitz, E. (2002). Socioeconomic status and health: The potential role of environmental risk exposure. Annual Review of Public Health, 23(1), 303-331. https://doi.org/10.1146/annurev.publhealth.23.112001.112349
Foraster, M., Esnaola, M., López-Vicente, M., Rivas, I., Álvarez-Pedrerol, M., Persavento, C., Sebastian-Galles, N., Pujol, J., Dadvand, P., & Sunyer, J. (2022). Exposure to road traffic noise and cognitive development in schoolchildren in Barcelona, Spain: A population-based cohort study. PLOS Medicine, 19(6), e1004001. https://doi.org/10.1371/journal.pmed.1004001
Greene, W. H. (2020). Econometric analysis (8th global ed.). Pearson. https://api.pageplace.de/preview/DT0400.9781292231150_A39514649/preview-9781292231150_A39514649.pdf
Havard, S., Reich, B. J., Bean, K., & Chaix, B. (2011). Social inequalities in residential exposure to road traffic noise: An environmental justice analysis based on the RECORD Cohort Study. Occupational and Environmental Medicine, 68(5), 366-374. https://doi.org/10.1136/oem.2010.060640
Hayward, M., & Helbich, M. (2024). Environmental noise is positively associated with socioeconomically less privileged neighborhoods in the Netherlands. Environmental Research, 248, 118294. https://doi.org/10.1016/j.envres.2024.118294
Herrera, C., & Cabrera-Barona, P. (2022). Impact of perceptions of air pollution and noise on subjective well-being and health. Earth, 3(3), 825-838. https://doi.org/10.3390/earth3030047
Analysing Malta’s implementation of Directive 2002/49/EC on the assessment and management of environmental noise. European Parliament (2026). https://www.europarl.europa.eu/thinktank/en/document/IUST_STU(2026)783089
Hoffmann, B., Robra, B. P., & Swart, E. (2003). Soziale Ungleichheit und Strassenlärm im Wohnumfeld-eine Auswertung des Bundesgesundheitssurveys. Das Gesundheitswesen, 65(06), 393-401. https://doi.org/10.1055/s-2003-40308
Lelieveld, J., Klingmüller, K., Pozzer, A., Burnett, R. T., Haines, A., & Ramanathan, V. (2019). Effects of fossil fuel and total anthropogenic emission removal on public health and climate. Proceedings of the National Academy of Sciences, 116(15), 7192-7197. https://doi.org/10.1073/pnas.1819989116
Lercher, P. (1996). Environmental noise and health: An integrated research perspective. Environment International, 22(1), 117-129. https://doi.org/10.1016/0160-4120(95)00109-3
Libertun de Duren, N. R., López Benítez, B., Bonilla, J. P., Regalia, F., Bilal, U., Ibáñez, A. M., Schady, N., Chauvin, J. P., Pinillos, J., Hoffmann, B., Medina, M. P., Blackman, A., Savedoff, W. D., Slesinski, C., Cortínez-O’Ryan, A., Indvik, K., Mazariego, M., Morais, L. M. de O., Vidaña-Pérez, D., Rubinstein, A., Cejas, C., Corburn, J., Pérez-Jaramillo, J., & Martinez-Herrera, E. (2022). Inclusive Cities: Healthy Cities for All (N. R. Libertun de Duren, Ed.). Inter-American Development Bank. https://doi.org/10.18235/0004459
Maione, M., Mocca, E., Eisfeld, K., Kazepov, Y., & Fuzzi, S. (2021). Public perception of air pollution sources across Europe. Ambio, 50(6), 1150-1158. https://doi.org/10.1007/s13280-020-01450-5
Markevych, I., Schoierer, J., Hartig, T., Chudnovsky, A., Hystad, P., Dzhambov, A. M., de Vries, S., Triguero-Mas, M., Brauer, M., Nieuwenhuijsen, M. J., Lupp, G., Richardson, E. A., Astell-Burt, T., Dimitrova, D., Feng, X., Sadeh, M., Standl, M., Heinrich, J., & Fuertes, E. (2017). Exploring pathways linking greenspace to health: Theoretical and methodological guidance. Environmental Research, 158, 301-317. https://doi.org/10.1016/j.envres.2017.06.028
Miedema, H. M. E., & Vos, H. (1999). Demographic and attitudinal factors that modify annoyance from transportation noise. The Journal of the Acoustical Society of America, 105(6), 3336-3344. https://doi.org/10.1121/1.424662
United Nations. (2025). World Urbanization Prospects 2025: Summary of Results (UN DESA/POP/2025/TR/ NO. 12). https://doi.org/10.18356/9789211576788
Vlachokostas, C., Achillas, C., Michailidou, A. V., & Moussiopoulos Ν. (2012). Measuring combined exposure to environmental pressures in urban areas: An air quality and noise pollution assessment approach. Environment International, 39(1), 8-18. https://doi.org/10.1016/j.envint.2011.09.007
Walker, G. (2012). Environmental Justice: Concepts, Evidence and Politics. Routledge. https://doi.org/10.4324/9780203610671
Wooldridge, J. M. (2010). Econometric analysis of cross section and panel data (2nd ed.). MIT Press. https://ipcid.org/evaluation/apoio/Wooldridge%20-%20Cross-section%20and%20Panel%20Data.pdf
World Bank. (2025). World Development Report 2025: Standards for Development. https://doi.org/10.1596/978-1-4648-2275-9
World Health Organization. (2024). How much does environmental noise affect our health? WHO updates methods to assess health risks [News release]. https://www.who.int/europe/news/item/04-08-2024-how-much-does-environmental-noise-affect-our-health--who-updates-methods-to-assess-health-risks
World Health Organization Regional Office for Europe. (2025). Health risks of air pollution in Europe: HRAPIE-2 project: Updated guidance on concentration-response functions for health risk assessment of air pollution in the WHO European Region. https://www.who.int/europe/publications/i/item/9789289062633