
Assessing Natural Hazard Exposure and Demographic Vulnerability in Serbian LSGUs Using FAHP and FMULTIMOORA
Article Sidebar
Main Article Content
Abstract
Natural hazards increasingly represent a significant challenge to sustainable development, disaster risk reduction, and population wellbeing, particularly in regions affected by adverse demographic trends. This study examines the interaction between natural hazard exposure and demographic vulnerability across 25 Serbian local self-government units (LSGUs) through the integration of Geographic Information Systems (GIS), the Triangular Fuzzy Analytic Hierarchy Process (FAHP), and the Fuzzy MULTIMOORA method. Fifteen indicators were organized into three groups representing natural hazard exposure, hazard exposure within built-up areas, and demographic vulnerability. The hazard-related indicators included flood-prone areas, landslide and rockfall susceptibility, seismic hazard, hail-prone areas, and areas exposed to erosion and torrential floods. The demographic indicators included the shares of people with disabilities, population aged 65 years and over, population without educational attainment, economically inactive population, and elderly single-person households. Criterion weights were determined using Triangular FAHP, while Fuzzy MULTIMOORA was applied to rank LSGUs according to their integrated vulnerability. Additional group-specific Fuzzy MULTIMOORA analyses were conducted separately for each indicator group to identify the principal drivers of vulnerability. The integrated assessment identified Ljubovija, Vladičin Han, and Krupanj as the most vulnerable LSGUs, whereas Lebane, Gadžin Han, and Vladimirci occupied the lowest positions. The group-specific analyses further revealed that municipalities characterized by the highest demographic vulnerability were not necessarily those with the highest integrated vulnerability, emphasizing the importance of interactions among environmental and demographic dimensions of vulnerability. The study contributes to the understanding of local vulnerability patterns by integrating demographic and environmental perspectives within a unified decision-making framework. The proposed approach may support evidence-based disaster risk reduction policies, population protection measures, spatial planning, and local resilience-building initiatives in Serbia and other regions facing similar demographic and environmental challenges.
1 Introduction
A growing frequency and intensity of extreme natural events, combined with increasing population concentrations and environmental pressures, have contributed to rising disaster losses worldwide (United Nations Office for Disaster Risk Reduction [UNDRR], 2015; Intergovernmental Panel on Climate Change [IPCC], 2022). Serbia represents a particularly complex case, because its diverse natural conditions contribute to exposure to various natural hazards (Dragićević et al., 2011; Cvetković et al., 2026). Although natural hazards are often perceived primarily as physical phenomena, their impacts depend not only on the characteristics of hazardous events, but also on the vulnerability of exposed populations and communities. Consequently, vulnerability has become a central concept in disaster risk research, climate adaptation studies, and disaster risk reduction policies. The Sendai Framework for Disaster Risk Reduction 2015–2030 emphasizes the need to understand disaster risk through the interaction of hazards, exposure, vulnerability, and population characteristics (UNDRR, 2015). Similarly, the Sixth Assessment Report of the Intergovernmental Panel on Climate Change highlights that demographic, social, and economic conditions substantially influence both the severity of disaster impacts and the capacity of communities to adapt and recover (IPCC, 2022). These perspectives have reinforced the view that hazard occurrence alone cannot adequately explain spatial differences in disaster outcomes.
Within contemporary disaster risk frameworks, hazard, exposure, vulnerability, and risk represent related but conceptually distinct components. Hazard refers to the potential occurrence of a physical event or process that may cause adverse effects, whereas exposure describes the presence of people, infrastructure, assets, or other elements in locations that may be adversely affected. Vulnerability refers to the conditions that increase the susceptibility of exposed populations or systems to harm and influence their capacity to anticipate, cope with, and recover from hazardous events. Disaster risk emerges from the interaction among these components, rather than from any of them considered independently (UNDRR, 2015).
Vulnerability is commonly defined as the propensity of individuals, households, communities, or systems to experience adverse consequences when exposed to hazardous events (Adger, 2006; Birkmann, 2006). Among the most influential conceptualizations, Cutter et al. (2003) emphasize the interaction between biophysical exposure and social vulnerability, arguing that disaster impacts emerge through the combined effects of environmental conditions and social characteristics. This conceptual framework has inspired numerous studies seeking to integrate physical and social dimensions of vulnerability within a single analytical approach. Particular attention has been devoted to demographic characteristics that may increase susceptibility to natural hazards. Previous research has shown that older adults, people with disabilities, individuals with low educational attainment, and economically disadvantaged population groups frequently experience disproportionate disaster impacts because of reduced mobility, limited access to resources, lower adaptive capacity, and greater dependence on external assistance (Cutter & Finch, 2008; Fekete, 2009; Wisner et al., 2014). Recent studies have further emphasized that ageing populations may face higher disaster risks due to health limitations, social isolation, and increasing dependence on institutional support systems (United Nations, 2024; Esendemir et al., 2025).
Changes in the size and structure of human populations have historically received limited attention in natural hazards research and risk management (Clar et al., 2021). Recent research on natural hazards and disaster risk reduction has generated substantial insights into the relationships between demographic characteristics and natural hazard risk management (Clar, 2019). The importance of demographic vulnerability is particularly evident in countries experiencing pronounced demographic challenges. Serbia has undergone long-term population ageing, depopulation, and significant regional demographic disparities, resulting in growing shares of elderly and economically inactive populations in many local communities. Similar demographic processes have been documented across numerous European regions affected by population decline and rural shrinkage, where demographic change has become an increasingly important determinant of local resilience and adaptive capacity (United Nations, 2024; Newsham & Rowe, 2023). Such demographic trends may substantially influence local capacities for disaster preparedness, response, and recovery.
The assessment of vulnerability at the local level has become increasingly important because disaster impacts are rarely distributed uniformly across space. Even within the same country, local communities may differ considerably in terms of hazard exposure, demographic structure, socioeconomic characteristics, and institutional capacities. Consequently, local self-government units (LSGUs) represent an appropriate spatial level for identifying vulnerable populations and designing targeted disaster risk reduction measures. Assessments conducted at this level can support more efficient allocation of resources, prioritization of preventive actions, and development of evidence-based emergency management strategies (UNDRR, 2015).
The growing availability of spatial data has significantly enhanced the capacity to analyze vulnerability and disaster risk. Geographic Information Systems (GIS) have become indispensable tools for integrating, managing, and visualizing diverse environmental and socioeconomic datasets (Malczewski, 1999; Malczewski, 2006). In disaster studies, GIS has been widely applied for flood susceptibility mapping, landslide assessment, seismic hazard analysis, and vulnerability evaluation, enabling researchers to examine spatial relationships between hazards and exposed populations (Rashed & Weeks, 2003). However, vulnerability assessment typically involves numerous indicators characterized by different units of measurement, scales, and relative importance, which necessitates the application of multi-criteria decision-making (MCDM) approaches.
Among the MCDM techniques, the Analytic Hierarchy Process (AHP) developed by Saaty (1980) remains one of the most frequently used methods for determining criterion weights. To address uncertainty and subjectivity inherent in expert judgments, researchers have increasingly integrated fuzzy set theory into the AHP framework, resulting in the development of Fuzzy AHP approaches (Buckley, 1985; Chang, 1996). Fuzzy set theory implements data with boundaries that are not sharply defined (Vadrevu, 2009). By incorporating fuzzy numbers into pairwise comparison matrices, Fuzzy AHP provides a more realistic representation of expert knowledge and uncertainty than conventional crisp approaches. Another widely applied MCDM method is Multi-Objective Optimization by Ratio Analysis plus the Full Multiplicative Form (MULTIMOORA), which was developed as a robust decision-making framework capable of evaluating alternatives according to multiple criteria simultaneously (Brauers & Zavadskas, 2006; Brauers & Zavadskas, 2010). Owing to its ability to combine ratio system, reference point, and full multiplicative form approaches within a unified framework, MULTIMOORA has become increasingly popular in environmental management, sustainability assessment, and regional development studies. The use of Fuzzy logic facilitates a more objective evaluation of the relationships among indicators and contributes to a more reliable ranking of the analyzed alternatives (Novković et al., 2024).
Recent studies have successfully applied fuzzy multi-criteria decision-making approaches to a wide range of environmental and spatial planning problems. In Serbia, such methods have been employed in environmental vulnerability assessment, sustainable development evaluation, and spatial planning studies, demonstrating their effectiveness in addressing complex decision-making problems characterized by uncertainty and multiple interacting factors (Novkovic et al., 2021; Malinić et al., 2025). Nevertheless, despite the growing application of the fuzzy MCDM approaches in hazard-related research, relatively limited attention has been devoted to the simultaneous consideration of natural hazard exposure and demographic vulnerability at the level of local self-government units. Most previous studies have focused either on physical hazard assessment, or on demographic and social vulnerability indicators separately. Consequently, there remains a need for integrated approaches capable of examining how demographic characteristics interact with environmental hazards in shaping overall local vulnerability. This issue is particularly relevant in Serbia, where many municipalities are simultaneously exposed to various natural hazards and affected by adverse demographic processes, including population ageing, depopulation, and increasing shares of vulnerable population groups.
The aim of this study is to examine the interaction between natural hazard exposure and demographic vulnerability across the selected Serbian LSGUs, through the integration of GIS-based indicators and fuzzy multi-criteria decision-making methods. By combining hazard-related and demographic indicators within a Triangular Fuzzy AHP–Fuzzy MULTIMOORA framework, the study seeks to identify local communities facing the greatest integrated vulnerability, and to contribute to more targeted disaster risk reduction and population protection policies.
Based on the theoretical framework and previous empirical findings, the following research hypotheses were formulated:
H1: Overall vulnerability to natural hazards is determined by the interaction between physical hazard exposure and demographic vulnerability, rather than by either dimension considered independently.
H2: LSGUs characterized by both high natural hazard exposure and unfavorable demographic characteristics achieve higher integrated vulnerability scores than units in which only one of these dimensions is pronounced.
2 Study Area, Data and Indicators
2.1 Selected Local Self-Government Units
The study was conducted on a sample of 25 local self-government units (LSGUs) in Serbia. The municipalities were selected according to a single spatial criterion, namely their territorial area. Only the municipalities with areas ranging between 300 and 400 km² were included in the analysis. No additional criterion related to geographical proximity, regional affiliation, or adjacency among the LSGUs was applied. Consequently, the occurrence of several neighboring LSGUs in some parts of Serbia, as well as geographically isolated units elsewhere, is solely a result of applying the predefined territorial-area criterion to all LSGUs. This spatial pattern should therefore not be interpreted as a regional sampling strategy. This approach was adopted to minimize the influence of substantial differences in municipal size and to enable a more consistent comparison of hazard exposure and demographic characteristics among the analyzed units. Consequently, the selected municipalities should be regarded as a group of territorially comparable LSGUs, rather than a statistically representative sample of all Serbian municipalities. The intention was not to provide a nationwide ranking of vulnerability, but rather to examine how interactions between natural hazard exposure and demographic vulnerability manifest among local units characterized by similar territorial dimensions.
The 300–400 km² range was introduced as a technical criterion to obtain a set of LSGUs with broadly comparable territorial dimensions and thereby reduce the influence of pronounced differences in municipal area on the comparison of spatial exposure indicators. The selected range should not be interpreted as an optimal or mathematically superior spatial threshold, but rather as a means of controlling territorial heterogeneity within the comparative analysis. This approach differs from regional or river-basin-based sampling, which would be more appropriate for studies aimed at analyzing spatially continuous hazard processes, or functional relationships between neighboring units. The present study instead focuses on comparing the interaction between hazard-related exposure and demographic vulnerability at the administrative level of individual LSGUs.
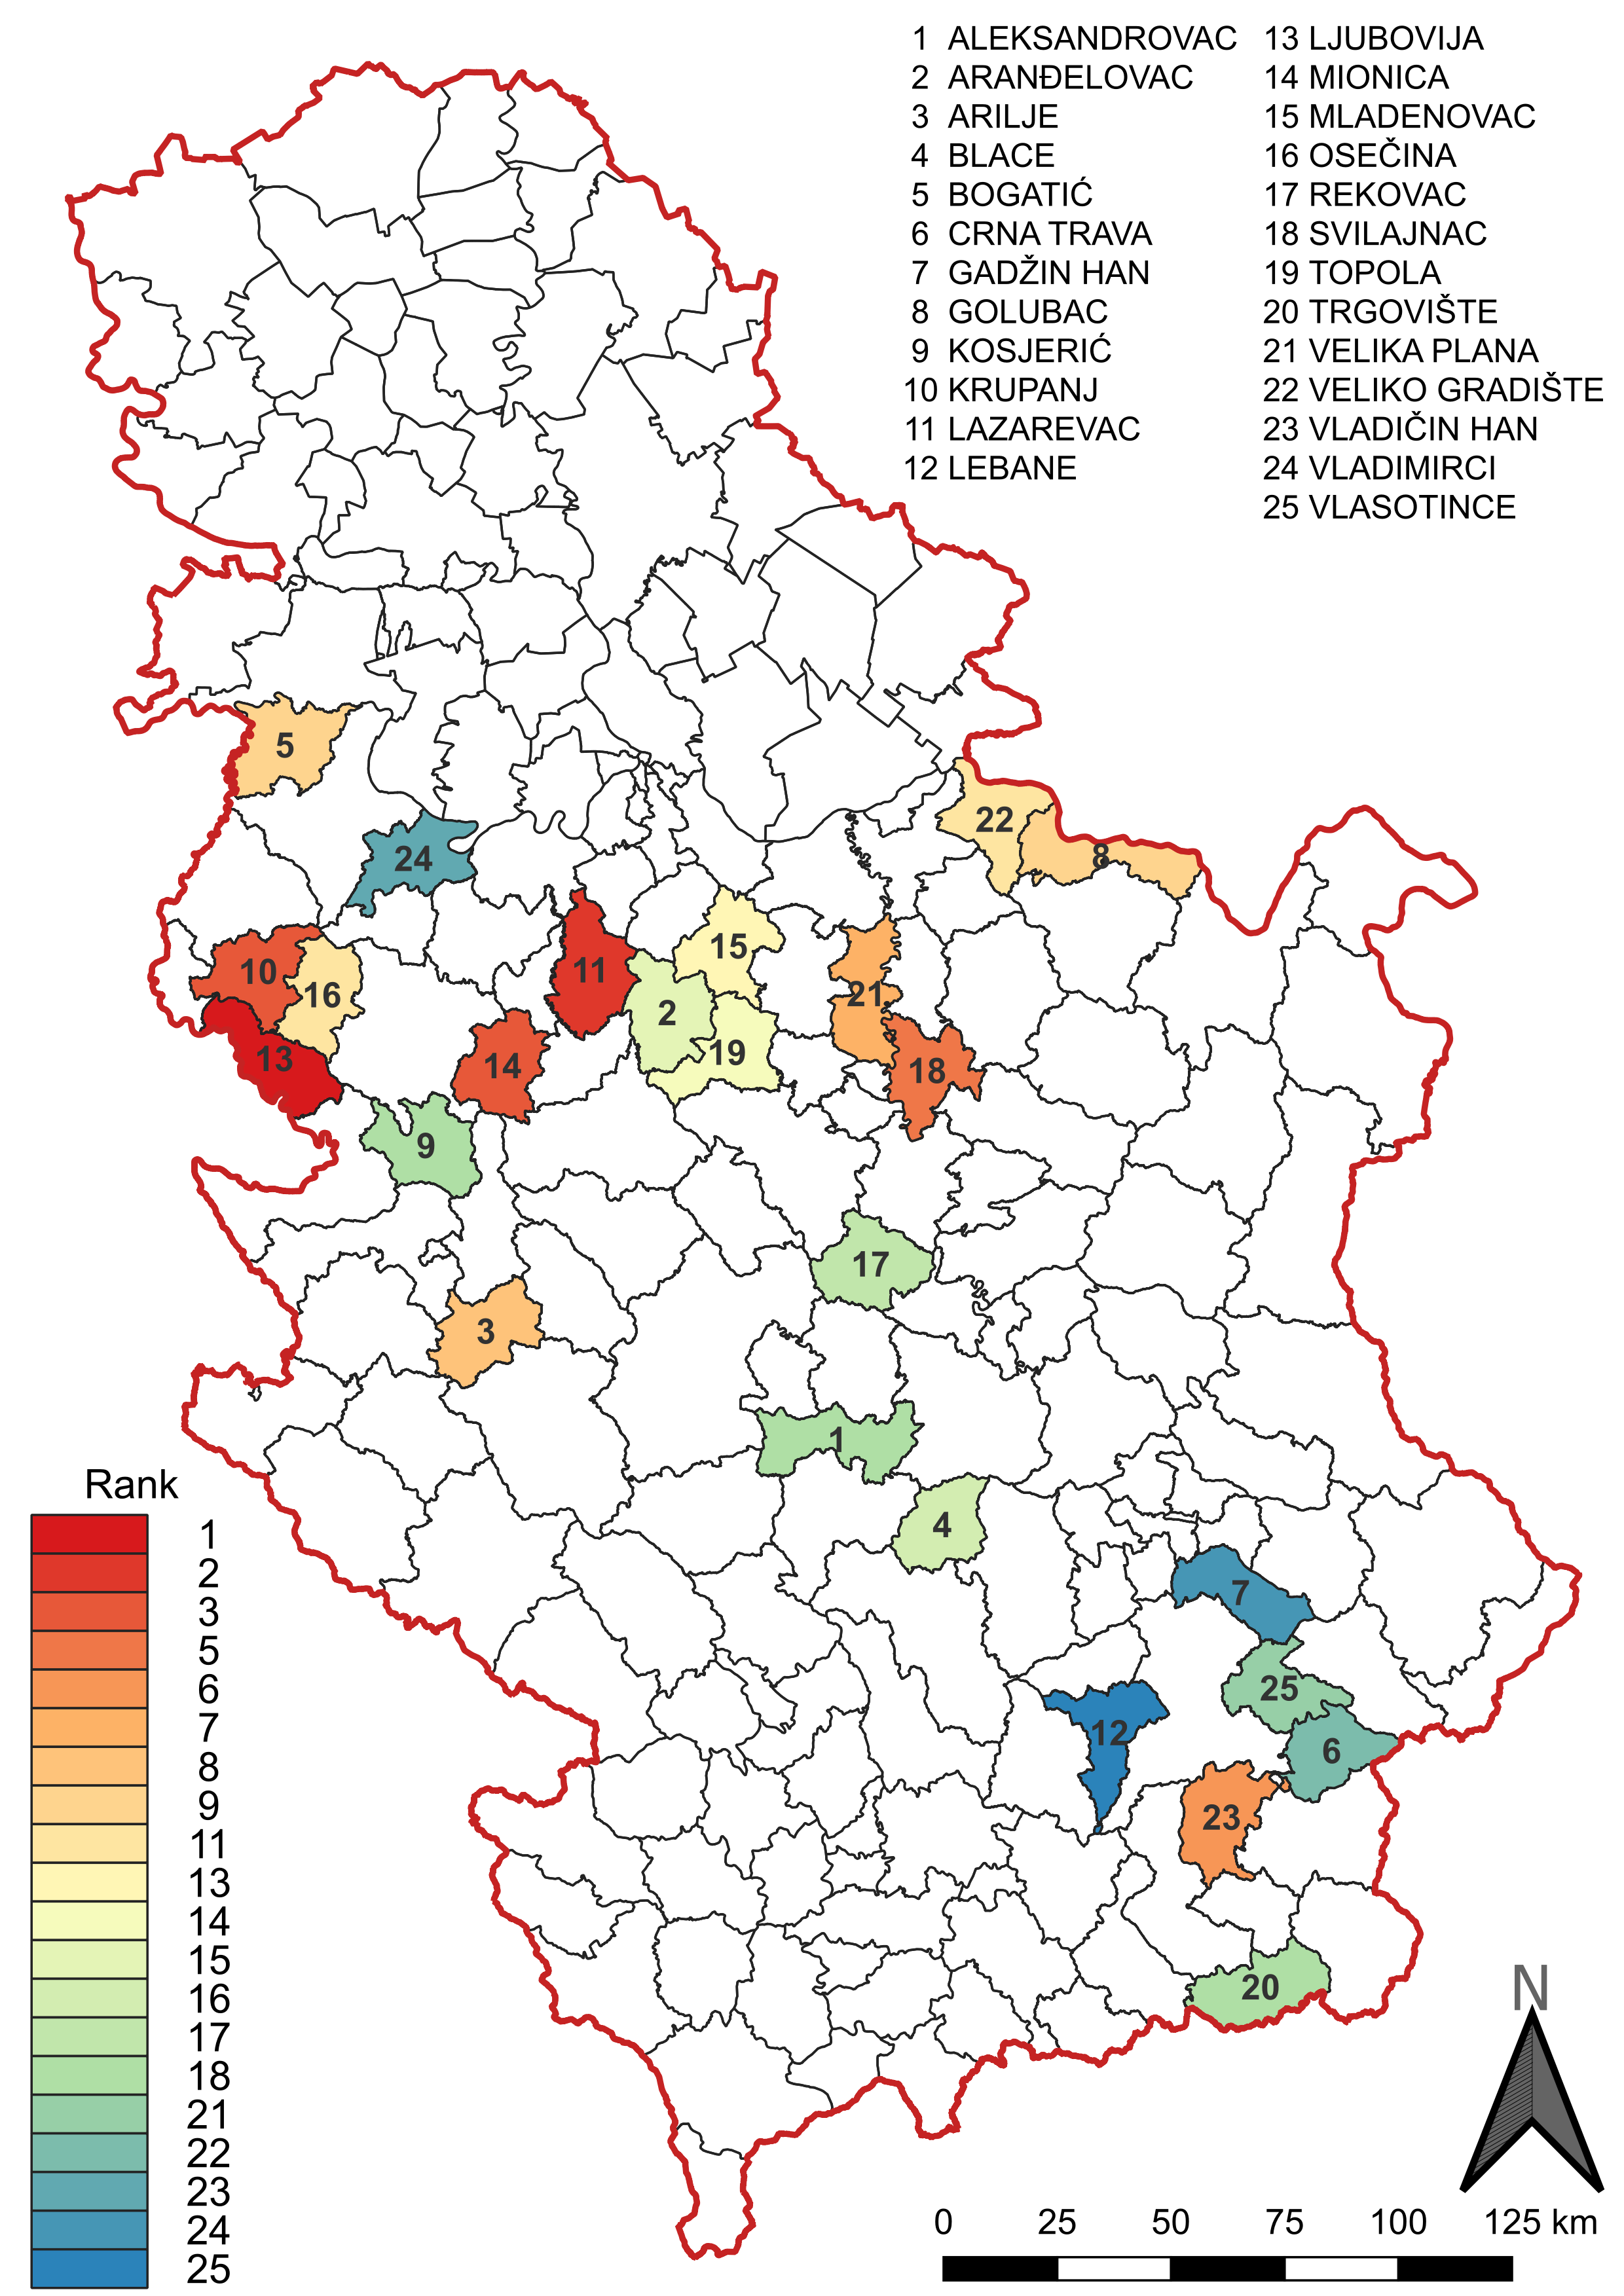
As a result of applying the territorial-area criterion, the selected LSGUs are distributed across different parts of Serbia and encompass diverse demographic, socioeconomic, and environmental conditions. The sample includes municipalities from various parts of Central Serbia, characterized by different levels of population density, demographic ageing, economic development, and exposure to natural hazards. Such diversity provides a suitable basis for examining the relationship between natural hazard exposure and demographic vulnerability at the local level. The basic characteristics of the analyzed LSGUs, including area, population size, built-up area, and share of built-up land, are presented in Table 1 and Figure 1.
| Local self-government unit | Population 2022 | Area [km2] | Built-up area [km2] | Built-up area [%] |
|---|---|---|---|---|
| Aleksandrovac | 22,069 | 386.6 | 15.25 | 3.94 |
| Aranđelovac | 41,297 | 375.8 | 27.40 | 7.29 |
| Arilje | 17,063 | 349.1 | 10.27 | 2.94 |
| Blace | 9,682 | 306.2 | 12.03 | 3.93 |
| Bogatić | 24,522 | 384.3 | 26.45 | 6.88 |
| Crna Trava | 1,063 | 312.0 | 1.46 | 0.47 |
| Gadžin Han | 5,850 | 324.7 | 8.19 | 2.52 |
| Golubac | 6,599 | 367.3 | 6.68 | 1.82 |
| Kosjerić | 10,175 | 358.6 | 14.43 | 4.02 |
| Krupanj | 14,399 | 341.7 | 13.80 | 4.04 |
| Lazarevac | 55,146 | 383.0 | 38.33 | 10.01 |
| Lebane | 18,119 | 336.8 | 11.58 | 3.44 |
| Ljubovija | 12,168 | 356.2 | 11.00 | 3.09 |
| Mionica | 12,061 | 329.6 | 19.05 | 5.78 |
| Mladenovac | 48,683 | 339.0 | 35.57 | 10.49 |
| Osečina | 9,951 | 318.6 | 17.74 | 5.57 |
| Rekovac | 8,116 | 366.0 | 9.90 | 2.70 |
| Svilajnac | 20,141 | 326.1 | 19.56 | 6.00 |
| Topola | 19,134 | 356.6 | 18.81 | 5.27 |
| Trgovište | 4,316 | 370.6 | 1.60 | 0.43 |
| Velika Plana | 35,451 | 345.2 | 26.96 | 7.81 |
| Veliko Gradište | 15,455 | 342.9 | 14.97 | 4.37 |
| Vladičin Han | 17,532 | 365.8 | 10.19 | 2.79 |
| Vladimirci | 14,427 | 337.6 | 19.07 | 5.65 |
| Vlasotince | 25,695 | 307.9 | 10.21 | 3.32 |
| Source: Statistical Office of the Republic of Serbia (2023), 2022 Population Census. | ||||
Figure 1. Spatial distribution of the investigated local self-government units within Serbia
2.2 Natural Hazard Exposure Indicators
Natural hazard exposure was assessed using two groups of indicators. The first group (Group A) represents the overall spatial extent of natural hazards within municipal territories, whereas the second group (Group B) captures hazard exposure specifically within built-up areas. The distinction between these groups was introduced to differentiate between hazard occurrence across municipal territories and their direct potential impacts on settlements, population, infrastructure, and economic activities. Five natural hazards were considered in the analysis: floods, landslides and rockfalls, seismic hazard, hail, and exposure to erosion and torrential floods. These hazards were selected because of their spatial prevalence in Serbia and their documented environmental, economic, and social impacts. Group A included the following indicators:
A1 – share of flood-prone areas;
A2 – share of landslide- and rockfall-prone areas;
A3 – share of areas exposed to seismic hazard;
A4 – share of hail-prone areas;
A5 – share of areas exposed to erosion and torrential floods.
These indicators quantify the proportion of municipal territory affected by each hazard, regardless of population distribution and land-use characteristics. The second group of indicators (Group B) consisted of analogous measures calculated exclusively for built-up areas:
B1 – share of flood-prone built-up areas;
B2 – share of landslide- and rockfall-prone built-up areas;
B3 – share of seismically exposed built-up areas;
B4 – share of hail-prone built-up areas;
B5 – share of built-up areas exposed to erosion and torrential floods.
Unlike the Group A indicators, Group B directly reflects the exposure of residential, commercial, industrial, and other developed areas to natural hazards. Since disaster impacts are strongly associated with the exposure of population and infrastructure, these indicators establish an important connection between environmental hazards and societal consequences. The separation of hazard occurrence and hazard exposure within built-up areas enables a more nuanced assessment of vulnerability. A municipality may contain extensive hazard-prone territory, while exposing only a limited share of its population and infrastructure, or vice versa. Consequently, the simultaneous consideration of Groups A and B provides a more comprehensive representation of local hazard-related vulnerability.
Accordingly, Groups A and B should primarily be interpreted as hazard-related exposure dimensions, rather than as measures of vulnerability in a strict conceptual sense. Group A characterizes the spatial extent of hazard-prone areas within each LSGU, whereas Group B provides a more direct representation of exposure by identifying the proportion of built-up areas affected by these hazards. Their inclusion alongside demographic vulnerability indicators enables the assessment of how different levels of hazard-related exposure interact with the susceptibility of local populations.
2.3 Demographic Vulnerability Indicators
The third group of indicators (Group C) was designed to capture demographic dimensions of vulnerability. Previous studies have consistently demonstrated that demographic characteristics substantially influence the ability of individuals and communities to prepare for, respond to, and recover from natural hazards (Cutter et al., 2003; Cutter & Finch, 2008; Fekete, 2009). Five demographic indicators were selected:
C1 – share of people with disabilities;
C2 – share of population aged 65 years and over;
C3 – share of population without educational attainment;
C4 – share of economically inactive population;
C5 – share of elderly single-person households.
People with disabilities often experience reduced mobility, communication barriers, and greater dependence on external assistance during emergency situations. Consequently, disability is widely recognized as an important component of social and demographic vulnerability within disaster risk reduction frameworks. The indicator refers to persons aged two years and over with disabilities, following the classification applied in the 2022 Population Census by the Statistical Office of the Republic of Serbia. The lower age threshold was therefore determined by the methodology and structure of the official census data, rather than introduced as an analytical threshold in this study. The share of population aged 65 years and over was included because older adults are frequently identified as one of the most vulnerable population groups during natural hazards. Increased health risks, limited mobility, and greater dependence on social support networks may reduce their capacity to cope with emergency situations and post-disaster recovery processes (Cutter & Finch, 2008; IPCC, 2022; United Nations, 2024; Esendemir et al., 2025).
Educational attainment represents another important determinant of vulnerability. Individuals with low levels of education may face greater difficulties in accessing information, understanding warnings, adopting preventive measures, and utilizing available institutional support mechanisms (Wisner et al., 2014). Economic inactivity was included because limited economic resources may reduce household capacities for preparedness, adaptation, and recovery. Communities characterized by higher shares of economically inactive population often exhibit lower resilience and reduced adaptive capacity in the face of hazardous events (Adger, 2006; Birkmann, 2006).
Finally, elderly single-person households were considered an important indicator because they frequently possess weaker social support networks and may require additional assistance during emergency response and recovery phases. Such households are increasingly recognized as vulnerable demographic groups in ageing societies (Fekete, 2009; United Nations, 2024; Esendemir et al., 2025). The selected indicators were chosen based on their demonstrated relevance in previous vulnerability studies and the availability of reliable and spatially comparable data at the municipal level. Together, they provide a comprehensive representation of demographic vulnerability and complement the environmental dimensions captured through Groups A and B. In contrast to Groups A and B, Group C therefore represents the vulnerability component of the analytical framework, focusing specifically on the demographic characteristics that may increase susceptibility and reduce coping and recovery capacities.
2.4 Data Sources and GIS Processing
The data describing natural hazard exposure were obtained from the Spatial Plan of the Republic of Serbia 2021–2035 (Ministry of Construction, Transport and Infrastructure of the Republic of Serbia, 2021), which contains nationally standardized spatial datasets related to flood-prone areas, landslides and rockfalls, seismic hazard, hail-prone areas, and erosion and torrential flood susceptibility. The demographic indicators were derived from the 2022 Population Census conducted by the Statistical Office of the Republic of Serbia (2023).
The spatial analyses were performed within a Geographic Information System (GIS) environment. Hazard layers were intersected with municipal boundaries and built-up area polygons to calculate the values of hazard exposure indicators. This procedure enabled the quantification of both total hazard occurrence (Group A) and hazard exposure within developed areas (Group B). The resulting spatial datasets were subsequently integrated with the demographic data and used as input for the multi-criteria decision-making analysis. Prior to the application of the decision-making methods, all the indicators were reviewed to ensure consistency, comparability, and suitability for further analysis.
The final database consisted of fifteen indicators organized into three thematic groups representing natural hazard exposure, hazard exposure within built-up areas, and demographic vulnerability. These indicators formed the basis for the subsequent application of the Triangular Fuzzy Analytic Hierarchy Process and Fuzzy MULTIMOORA methods. Indicator values of investigated local self-government units are shown in Tables 2, 3 and 4.
| Local self-government unit | Flood-prone [%] | Landslide- and rockfall- prone [%] | Seismic hazard over VIII MCS [%] | Hail-prone [%] | High erosion and torrential flood potential [%] |
|---|---|---|---|---|---|
| Aleksandrovac | 0.26 | 12.64 | 66.20 | 27.15 | 11.87 |
| Aranđelovac | 2.63 | 11.90 | 15.06 | 52.27 | 2.95 |
| Arilje | 0.29 | 16.27 | 17.42 | 80.19 | 23.96 |
| Blace | 0.33 | 5.66 | 81.40 | 26.41 | 0.84 |
| Bogatić | 74.43 | 0.00 | 0.00 | 1.15 | 0.00 |
| Crna Trava | 0.32 | 12.27 | 0.00 | 0.47 | 5.71 |
| Gadžin Han | 0.98 | 5.46 | 0.00 | 0.07 | 11.01 |
| Golubac | 6.42 | 23.00 | 46.33 | 0.01 | 3.24 |
| Kosjerić | 0.28 | 46.67 | 0.00 | 61.71 | 14.71 |
| Krupanj | 2.49 | 61.37 | 1.55 | 47.71 | 22.33 |
| Lazarevac | 34.94 | 20.89 | 51.56 | 11.11 | 1.61 |
| Lebane | 0.30 | 0.02 | 0.00 | 39.86 | 2.20 |
| Ljubovija | 6.45 | 45.65 | 29.76 | 88.22 | 34.03 |
| Mionica | 13.08 | 32.00 | 38.19 | 22.85 | 8.04 |
| Mladenovac | 15.24 | 5.87 | 60.52 | 2.27 | 0.10 |
| Osečina | 0.31 | 52.34 | 0.00 | 90.21 | 18.93 |
| Rekovac | 0.27 | 9.41 | 100.00 | 9.08 | 2.26 |
| Svilajnac | 28.96 | 11.37 | 100.00 | 2.68 | 0.14 |
| Topola | 2.34 | 9.24 | 54.37 | 33.00 | 3.04 |
| Trgovište | 0.27 | 8.90 | 12.37 | 41.33 | 25.58 |
| Velika Plana | 49.58 | 1.67 | 100.00 | 2.06 | 0.00 |
| Veliko Gradište | 23.99 | 3.94 | 25.86 | 0.01 | 0.06 |
| Vladičin Han | 7.14 | 14.15 | 30.41 | 26.57 | 9.37 |
| Vladimirci | 11.69 | 4.17 | 0.00 | 0.01 | 0.00 |
| Vlasotince | 2.43 | 15.92 | 0.00 | 42.73 | 9.77 |
| Local self-government unit | Flood-prone [%] | Landslide- and rockfall- prone [%] | Seismic hazard over VIII MCS [%] | Hail-prone [%] | High erosion and torrential flood potential [%] |
|---|---|---|---|---|---|
| Aleksandrovac | 0.33 | 12.90 | 90.94 | 12.05 | 6.93 |
| Aranđelovac | 2.91 | 10.60 | 16.46 | 61.83 | 3.60 |
| Arilje | 0.49 | 39.87 | 67.45 | 88.86 | 28.18 |
| Blace | 0.42 | 8.12 | 98.43 | 35.54 | 1.04 |
| Bogatić | 77.21 | 0.00 | 0.00 | 0.08 | 0.00 |
| Crna Trava | 3.42 | 16.70 | 0.00 | 0.32 | 18.51 |
| Gadžin Han | 0.72 | 7.81 | 0.00 | 0.01 | 17.44 |
| Golubac | 30.69 | 14.87 | 86.45 | 0.01 | 1.41 |
| Kosjerić | 0.35 | 51.70 | 0.00 | 52.52 | 20.64 |
| Krupanj | 10.34 | 69.86 | 3.00 | 37.58 | 32.20 |
| Lazarevac | 52.42 | 18.22 | 62.40 | 3.58 | 0.30 |
| Lebane | 0.43 | 0.00 | 0.00 | 8.72 | 0.72 |
| Ljubovija | 23.29 | 48.21 | 56.16 | 74.48 | 55.01 |
| Mionica | 13.23 | 33.71 | 48.16 | 13.30 | 9.83 |
| Mladenovac | 21.11 | 4.51 | 74.32 | 0.60 | 0.11 |
| Osečina | 0.28 | 52.84 | 0.00 | 90.41 | 24.51 |
| Rekovac | 0.51 | 14.55 | 100.00 | 4.31 | 1.97 |
| Svilajnac | 40.59 | 7.39 | 100.00 | 0.21 | 0.03 |
| Topola | 4.26 | 8.81 | 62.09 | 25.24 | 3.01 |
| Trgovište | 3.13 | 22.84 | 13.94 | 54.84 | 21.04 |
| Velika Plana | 56.79 | 1.16 | 99.98 | 0.72 | 0.00 |
| Veliko Gradište | 39.03 | 3.32 | 31.57 | 0.01 | 0.08 |
| Vladičin Han | 38.51 | 13.86 | 72.79 | 5.95 | 9.87 |
| Vladimirci | 8.13 | 1.86 | 0.00 | 0.01 | 0.00 |
| Vlasotince | 5.99 | 7.41 | 0.00 | 57.75 | 9.80 |
| Local self-government unit | People with disabilities [%] | Population aged 65+ [%] | People lacking education [%] | Economically inactive population [%] | Elderly single-person households [%] |
|---|---|---|---|---|---|
| Aleksandrovac | 6.54 | 26.38 | 37.74 | 65.59 | 23.94 |
| Aranđelovac | 4.71 | 22.59 | 23.21 | 58.70 | 21.88 |
| Arilje | 3.28 | 22.75 | 29.86 | 61.36 | 24.00 |
| Blace | 5.69 | 27.06 | 28.11 | 63.44 | 28.77 |
| Bogatić | 5.56 | 22.55 | 39.86 | 66.72 | 19.59 |
| Crna Trava | 13.92 | 41.02 | 43.44 | 71.12 | 42.83 |
| Gadžin Han | 10.29 | 37.26 | 41.86 | 65.50 | 39.27 |
| Golubac | 7.43 | 33.35 | 46.93 | 69.09 | 32.67 |
| Kosjerić | 4.73 | 27.58 | 39.72 | 64.11 | 27.95 |
| Krupanj | 4.90 | 23.95 | 41.41 | 71.79 | 21.25 |
| Lazarevac | 4.46 | 19.61 | 21.38 | 54.66 | 19.40 |
| Lebane | 6.43 | 22.92 | 35.15 | 60.58 | 23.02 |
| Ljubovija | 3.16 | 22.82 | 36.51 | 63.21 | 21.96 |
| Mionica | 6.09 | 25.74 | 42.66 | 62.51 | 25.33 |
| Mladenovac | 6.15 | 22.83 | 24.61 | 57.73 | 20.52 |
| Osečina | 6.74 | 26.83 | 53.87 | 61.89 | 26.38 |
| Rekovac | 8.08 | 35.44 | 46.69 | 62.06 | 34.85 |
| Svilajnac | 5.74 | 28.75 | 41.36 | 65.39 | 29.01 |
| Topola | 5.38 | 26.18 | 37.57 | 61.93 | 22.80 |
| Trgovište | 3.52 | 18.37 | 37.42 | 61.47 | 18.02 |
| Velika Plana | 7.20 | 23.59 | 31.77 | 62.16 | 22.31 |
| Veliko Gradište | 5.36 | 30.41 | 51.90 | 66.33 | 28.81 |
| Vladičin Han | 6.11 | 23.12 | 35.62 | 57.18 | 23.28 |
| Vladimirci | 5.55 | 25.53 | 42.38 | 70.32 | 24.16 |
| Vlasotince | 6.97 | 21.73 | 32.10 | 56.80 | 19.50 |
3 Methodology
3.1 Research Framework
The methodological framework of this study integrates Geographic Information Systems (GIS), the Triangular Fuzzy Analytic Hierarchy Process (FAHP), and the Fuzzy MULTIMOORA method to assess the interaction between natural hazard exposure and demographic vulnerability across selected Serbian local self-government units (LSGUs).
The procedure consisted of five main stages. First, spatial and demographic data were collected and processed within a GIS environment and fifteen indicators were organized into three thematic groups representing natural hazard exposure (Group A), hazard exposure within built-up areas (Group B), and demographic vulnerability (Group C). Second, criterion weights were determined using the Triangular Fuzzy Analytic Hierarchy Process. Third, Fuzzy MULTIMOORA was applied to obtain the integrated vulnerability ranking of the analyzed LSGUs, with the three subordinate rankings aggregated using the DDG procedure. Fourth, separate Fuzzy MULTIMOORA analyses were conducted for Groups A, B, and C to identify the principal drivers of vulnerability. Fifth, sensitivity analysis was performed to evaluate the robustness of the integrated ranking to the changes in the relative importance assigned to demographic vulnerability.
In addition to the integrated assessment, separate Fuzzy MULTIMOORA analyses were conducted for each indicator group. These supplementary analyses were intended to identify the relative contributions of natural hazard exposure, hazard exposure within built-up areas, and demographic vulnerability to overall municipal vulnerability, as well as to facilitate interpretation of the final ranking results.
The analytical framework does not attempt to quantify disaster risk in its complete probabilistic sense. Rather, it integrates two hazard-related exposure dimensions (Groups A and B) with a demographic vulnerability dimension (Group C) to identify relative differences among the analyzed LSGUs. The resulting integrated ranking should therefore be interpreted as a comparative measure of vulnerability arising from the interaction between hazard-related exposure and demographic susceptibility, rather than as a direct estimate of disaster risk or expected losses. The overall methodological workflow, including indicator selection, weighting, multicriteria ranking, group-specific analysis, and robustness assessment, is summarized in Figure 2.
Figure 2. Methodological workflow of the FAHP–Fuzzy MULTIMOORA–DDG vulnerability assessment framework.
3.2 Triangular Fuzzy Analytic Hierarchy Process
The Analytic Hierarchy Process (AHP), originally developed by Saaty (1980), is one of the most widely used multi-criteria decision-making methods for determining criterion weights. The method is based on pairwise comparisons between criteria and enables the derivation of relative importance coefficients. However, conventional AHP relies on precise numerical judgments, which may not adequately represent uncertainty and ambiguity inherent in expert evaluations. To overcome this limitation, fuzzy set theory introduced by Zadeh (1965) has been integrated into the AHP framework, resulting in the development of Fuzzy AHP approaches (Buckley, 1985; Chang, 1996).
In the present study, the Triangular Fuzzy AHP approach was employed. Expert judgments were incorporated through fuzzy pairwise comparison matrices based on triangular fuzzy numbers, enabling the representation of uncertainty associated with criterion comparisons. Pairwise comparison matrices were constructed separately for:
- indicators within Group A (Table 5);
- indicators within Group B (Table 6);
- indicators within Group C (Table 7);
- the three indicator groups themselves (Table 8).
| A | A1 | A2 | A3 | A4 | A5 |
|---|---|---|---|---|---|
| A1 | 1,1,1 | 0.6,1.6,2.6 | 0.8,1.8,2.8 | 1,2,3 | 1.2,2.2,3.2 |
| A2 | 1/2.6,1/1.6,1/0.6 | 1,1,1 | 0.7,1.7,2.7 | 0.8,1.8,2.8 | 1.1,2.1,3.1 |
| A3 | 1/2.8,1/1.8,1/0.8 | 1/2.7,1/1.7,1/0.7 | 1,1,1 | 0.75,1.75,2.75 | 1,2,3 |
| A4 | 1/3,1/2,1 | 1/2.8,1/1.8,1/0.8 | 1/2.75,1/1.75,1/0.75 | 1,1,1 | 0.8,1.8,2.8 |
| A5 | 1/3.2,1/2.2,1/1.2 | 1/3.1,1/2.1,1/1.1 | 1/3,1/2,1 | 1/2.8,1/1.8,1/0.8 | 1,1,1 |
| B | B1 | B2 | B3 | B4 | B5 |
|---|---|---|---|---|---|
| B1 | 1,1,1 | 0.7,1.7,2.7 | 0.75,1.75,2.75 | 0.9,1.9,2.9 | 1.1,2.1,3.1 |
| B2 | 1/2.7,1/1.7,1/0.7 | 1,1,1 | 0.7,1.7,2.7 | 0.8,1.8,2.8 | 1,2,3 |
| B3 | 1/2.75,1/1.75,1/0.75 | 1/2.7,1/1.7,1/0.7 | 1,1,1 | 0.75,1.75,2.75 | 0.9,1.9,2.9 |
| B4 | 1/2.9,1/1.9,1/0.9 | 1/2.8,1/1.8,1/0.8 | 1/2.75,1/1.75,1/0.75 | 1,1,1 | 0.8,1.8,2.8 |
| B5 | 1/3.1,1/2.1,1/1.1 | 1/3,1/2,1 | 1/2.9,1/1.9,1/0.9 | 1/2.8,1/1.8,1/0.8 | 1,1,1 |
| C | C1 | C2 | C3 | C4 | C5 |
|---|---|---|---|---|---|
| C1 | 1,1,1 | 0.65,1.65,2.65 | 0.75,1.75,2.75 | 0.9,1.9,2.9 | 1,2,3 |
| C2 | 1/2.65,1/1.65,1/0.65 | 1,1,1 | 0.7,1.7,2.7 | 0.8,1.8,2.8 | 0.9,1.9,2.9 |
| C3 | 1/2.75,1/1.75,1/0.75 | 1/2.7,1/1.7,1/0.7 | 1,1,1 | 0.75,1.75,2.75 | 0.85,1.85,2.85 |
| C4 | 1/2.9,1/1.9,1/0.9 | 1/2.8,1/1.8,1/0.8 | 1/2.75,1/1.75,1/0.75 | 1,1,1 | 0.7,1.7,2.7 |
| C5 | 1/3,1/2,1 | 1/2.9,1/1.9,1/0.9 | 1/2.85,1/1.85,1/0.85 | 1/2.7,1/1.7,1/0.7 | 1,1,1 |
| Group | A | B | C |
|---|---|---|---|
| A | 1,1,1 | 1/2.3,1/1.6,1/0.9 | 1/1.7,1/1.2,1/0.7 |
| B | 0.9,1.6,2.3 | 1,1,1 | 0.8,1.2,1.6 |
| C | 0.7,1.2,1.7 | 1/1.6,1/1.2,1/0.8 | 1,1,1 |
Based on the constructed matrices, fuzzy synthetic extent values were calculated following Chang’s (1996) extent analysis method. Subsequently, fuzzy weights were derived, normalized, and converted into crisp values to obtain the weighting coefficients for all the indicators and indicator groups. The final global weight of each criterion was obtained by multiplying the local criterion weight by the corresponding group weight, and they reflect both the relative importance of indicators within each group and the relative importance of Groups A, B, and C in the overall vulnerability assessment. A recognized limitation of Chang’s extent analysis is that, under certain configurations of fuzzy pairwise comparisons, some criteria may receive zero weights, potentially resulting in a loss of relevant decision information (Wang et al., 2008). This issue did not occur in the present study, as all the criteria and criterion groups obtained positive final weights.
Although fuzzy approaches reduce uncertainty associated with expert judgments, it remains necessary to evaluate the logical consistency of pairwise comparisons. Consistency analysis was therefore performed for all the comparison matrices. The fuzzy pairwise comparison matrices constructed using triangular fuzzy numbers were subsequently defuzzified (Novkovic et al., 2021). Defuzzification is the process of transforming fuzzy values into crisp outputs (Runkler, 1997). Following the standard AHP procedure, consistency ratios (CR) were calculated to assess the degree of coherence among expert judgments. According to Saaty (1980), consistency ratios below 0.10 indicate acceptable levels of consistency. All matrices used in this study satisfied this requirement, confirming the reliability of the obtained judgments and supporting the validity of the resulting weighting coefficients.
3.3 Fuzzy MULTIMOORA
The ranking of local self-government units was determined using the Fuzzy MULTIMOORA method. MULTIMOORA was developed as a multi-criteria decision-making framework that combines three complementary approaches: the Ratio System, the Reference Point Approach, and the Full Multiplicative Form (Brauers & Zavadskas, 2006, 2010). In the present study, the fuzzy extension of MULTIMOORA was applied to integrate the indicator values and the weighting coefficients obtained by the Triangular Fuzzy AHP and to derive the relative vulnerability ranking of the analyzed LSGUs.
The initial fuzzy decision matrix can be expressed as (Eq. 1):
where represents the number of alternatives (), represents the number of criteria (), and (Eq. 2)
is the triangular fuzzy value of an alternative with respect to the criterion . Since the original indicator values used in this study were crisp, they were represented as degenerate triangular fuzzy numbers, for which .
To enable comparison among indicators expressed on different numerical scales, vector normalization was performed. For each criterion , the normalization denominator was calculated using all alternatives (Eq. 3):
and the normalized fuzzy value was obtained as (Eq. 4):
All the indicators included in the present analysis were positively oriented with respect to vulnerability; therefore, higher criterion values represented greater hazard-related exposure or demographic vulnerability.
3.3.1 Fuzzy Ratio System (FRS)
Within the FRS approach, the normalized fuzzy values were multiplied by their corresponding global criterion weights obtained through Triangular Fuzzy AHP (Eq. 5):
where denotes the global weight of the criterion . The overall fuzzy assessment of the alternative was then calculated as (Eq. 6):
Because all criteria were positively oriented, no subtraction of non-beneficial criteria was required. The resulting fuzzy value was defuzzified according to (Eq. 7):
Alternatives were ranked in the descending order, with higher values indicating greater integrated vulnerability.
3.3.2 Fuzzy Reference Point Approach (FRPA)
The FRPA evaluates alternatives according to their deviation from the reference point. For each positively oriented criterion, the fuzzy reference point was defined component-wise from the maximum normalized values (Eq. 8):
The distance between the normalized fuzzy value of the alternative and the corresponding fuzzy reference point, was calculated using the vertex distance (Eq. 9):
The distance was subsequently multiplied by the corresponding criterion weight (Eq. 10):
For each alternative, the maximum weighted deviation from the reference point was then determined according to the minimax principle (Eq. 11):
In the FRPA, lower values indicate a smaller deviation from the reference point and consequently a higher rank.
3.3.3 Fuzzy Full Multiplicative Form (FFMF)
The Full Multiplicative Form evaluates alternatives through the multiplicative interaction among normalized criterion values. For the alternative , the fuzzy multiplicative assessment was calculated as (Eq. 12):
where represents the global weight of the criterion . The resulting fuzzy number can be expressed as (Eq. 13):
The fuzzy result was subsequently defuzzified as (Eq. 14):
Alternatives were ranked in the descending order according to , with higher values indicating greater vulnerability.
The FRS, FRPA, and FFMF therefore produced three separate rankings of the analyzed LSGUs. To integrate these rankings into a single final result, the Dominance-Directed Graph (DDG) approach was applied instead of arithmetic averaging of rank positions (Altuntas et al., 2015).
For each subordinate ranking, a dominance matrix was constructed, where (Eq. 15):
The matrix representing direct and second-order dominance relationships was then calculated as (Eq. 16):
The DDG score of the alternative within each subordinate ranking was obtained by summing the elements of the corresponding row (Eq. 17):
Finally, the DDG scores obtained from the three Fuzzy MULTIMOORA components were aggregated as (Eq. 18):
Alternatives were ranked in the descending order according to . In the event of equal aggregated DDG scores, direct dominance across the three subordinate rankings was used as the tie-breaking criterion. An alternative was assigned a higher final rank when it outranked the other alternative in at least two of the three Fuzzy MULTIMOORA components.
In addition to the integrated assessment based on all fifteen criteria, separate Fuzzy MULTIMOORA analyses were conducted for Group A (Natural Hazard Exposure), Group B (Hazard Exposure within Built-up Areas), and Group C (Demographic Vulnerability). The same DDG aggregation procedure was applied within each group to ensure methodological consistency between the group-specific and integrated rankings. These supplementary analyses enabled the identification of dominant vulnerability drivers and provided additional insights into the relationships between environmental and demographic dimensions of vulnerability.
3.4 Sensitivity Analysis
A sensitivity analysis was performed to evaluate the robustness of the integrated vulnerability ranking with respect to changes in the relative importance of demographic vulnerability. In addition to the baseline weighting scheme, three alternative scenarios were examined in which the cumulative weight of Group C was increased by 10%, 20%, and 30%. To preserve the total group weight at 1.0, the weights of Groups A and B were proportionally reduced while maintaining their original relative relationship. Local criterion weights within each group remained unchanged.
For each scenario, the global criterion weights were recalculated, and the complete Fuzzy MULTIMOORA procedure was repeated. The three resulting rankings were subsequently aggregated using the DDG approach. Ranking stability relative to the baseline scenario was evaluated using Spearman’s rank correlation coefficient, Top-5 and Top-10 overlap, and the maximum absolute change in rank.
3.5 Research Hypotheses and Interpretation Framework
The methodological framework was designed to evaluate two research hypotheses concerning the interaction between environmental and demographic dimensions of vulnerability.
H1: Overall vulnerability to natural hazards is determined by the interaction between physical hazard exposure and demographic vulnerability, rather than by either dimension considered independently.
H2: Local self-government units characterized by both high natural hazard exposure and unfavorable demographic characteristics achieve higher integrated vulnerability scores than the units in which only one of these dimensions is pronounced.
The integrated Fuzzy MULTIMOORA ranking served as the primary basis for hypothesis testing. However, the additional group-specific rankings enabled a more detailed interpretation of vulnerability patterns and allowed the relative influence of Groups A, B, and C to be examined separately. Special attention was devoted to identifying municipalities characterized by:
- high hazard exposure, but low demographic vulnerability;
- high demographic vulnerability, but low hazard exposure;
- simultaneously elevated values across multiple vulnerability dimensions.
This approach provided a more comprehensive understanding of the mechanisms shaping local vulnerability, and facilitated the interpretation of the final integrated rankings.
4 Results
The three subordinate Fuzzy MULTIMOORA approaches produced generally comparable but not identical ranking patterns, reflecting differences in the principles underlying FRS, FRPA, and FFMF. The application of DDG enabled these complementary rankings to be integrated without relying on the arithmetic averaging of rank positions. The resulting integrated ranking therefore reflects the combined information provided by all three components of the Fuzzy MULTIMOORA framework.
The observed ranking patterns suggest that overall vulnerability cannot be explained solely by the spatial extent of hazards or demographic conditions considered independently. Rather, vulnerability emerges through the interaction of multiple dimensions represented by the selected indicator groups. A more detailed examination of these relationships is provided by the group-specific rankings.
4.1 Criterion Weights and Consistency Analysis
The application of the Triangular Fuzzy Analytic Hierarchy Process resulted in the determination of weighting coefficients for all indicators included in the vulnerability assessment. The obtained weights reflect the relative importance assigned to natural hazard exposure, hazard exposure within built-up areas, and demographic vulnerability indicators.
The results indicate that indicators belonging to Group B generally received higher weights than the indicators from Groups A and C, emphasizing the importance of hazard exposure within built-up areas in the overall vulnerability assessment. This finding highlights the importance of the exposure of settlements, population, and infrastructure in the overall vulnerability assessment, beyond the spatial extent of hazard-prone areas alone.
Among all indicators, the highest weights were assigned to those describing the exposure of built-up areas to floods, landslides and rockfalls, seismic hazards, hail-prone areas, and erosion and torrential floods. In contrast, demographic indicators generally received lower individual weights, although their cumulative contribution remained substantial due to the importance of demographic vulnerability as a separate indicator group. The final indicator weights obtained through the Triangular Fuzzy AHP procedure are presented in Table 9.
| Group | Mark | Criterion | Final weighting coefficient |
|---|---|---|---|
| А | А1 | Flood-prone areas | 0.068178 |
| А | А2 | Landslide- and rockfall-prone areas | 0.062814 |
| А | А3 | Seismic hazard zones exceeding VIII degrees on the MCS scale | 0.056428 |
| А | А4 | Hail-prone areas | 0.047432 |
| А | А5 | Areas with the highest erosion and torrential flood potential | 0.033744 |
| B | B1 | Flood-prone built-up areas | 0.101219 |
| B | B2 | Landslide- and rockfall-prone built-up areas | 0.093193 |
| B | B3 | Seismic hazard zones exceeding VIII MCS in built-up areas | 0.084376 |
| B | B4 | Hail-prone built-up areas | 0.072229 |
| B | B5 | Built-up areas with the highest erosion and torrential flood potential | 0.053998 |
| C | C1 | People with disabilities in the population aged two years and older | 0.080247 |
| C | C2 | Population aged 65 years and over | 0.074301 |
| C | C3 | People lacking education among the population aged 15 years and over | 0.067499 |
| C | C4 | Economically inactive population | 0.057633 |
| C | C5 | Elderly single-person households | 0.046709 |
To verify the reliability of expert judgments, consistency ratios were calculated for all pairwise comparison matrices. The obtained values were below the commonly accepted threshold of 0.10, indicating satisfactory consistency and supporting the validity of the weighting process. The consistency ratio (CR) values were 0.073150, 0.077316, and 0.079947 for the fuzzy pairwise comparison matrices of Groups A, B, and C, while the CR value of the pairwise comparison matrix of the criterion groups was 0.061741. As all values were below the recommended threshold of 0.10, the matrices were considered consistent and suitable for further analysis.
4.2 Integrated Vulnerability Ranking
The integrated vulnerability ranking was obtained by applying the Fuzzy MULTIMOORA method to all fifteen indicators simultaneously. The three subordinate rankings obtained using the Fuzzy Ratio System (FRS), Fuzzy Reference Point Approach (FRPA), and Fuzzy Full Multiplicative Form (FFMF) were subsequently aggregated using the DDG procedure to derive the final ranking. The resulting ranking provides a comprehensive assessment of vulnerability by combining environmental and demographic dimensions within a single decision-making framework.
The results reveal considerable differences among the analyzed local self-government units. Ljubovija achieved the highest integrated vulnerability rank, followed by Vladičin Han and Krupanj, while Lazarevac and Mionica occupied the fourth and fifth positions. The high positions of these LSGUs are predominantly associated with pronounced hazard-related exposure, although the relative contribution of the environmental and demographic dimensions differs among them. At the opposite end of the ranking, Lebane, Gadžin Han, and Vladimirci occupied the lowest positions (Table 10, Figure 3). Although some lower-ranked LSGUs exhibit unfavorable demographic characteristics, their comparatively limited exposure to natural hazards, particularly within built-up areas, contributed to lower integrated vulnerability.
| Local self-government unit | Fuzzy Ratio System | Fuzzy Reference Point Approach | Fuzzy Full Multiplicative Form | DDG score | Finalrank |
|---|---|---|---|---|---|
| Ljubovija | 3 | 1 | 1 | 853 | 1 |
| Vladičin Han | 2 | 12 | 3 | 620 | 2 |
| Krupanj | 11 | 3 | 4 | 589 | 3 |
| Lazarevac | 1 | 9 | 8 | 589 | 4 |
| Mionica | 8 | 8 | 2 | 582 | 5 |
| Svilajnac | 5 | 6 | 13 | 478 | 6 |
| Arilje | 20 | 4 | 5 | 456 | 7 |
| Golubac | 4 | 10 | 14 | 417 | 8 |
| Velika Plana | 9 | 5 | 17 | 382 | 9 |
| Osečina | 25 | 2 | 16 | 321 | 10 |
| Topola | 14 | 19 | 6 | 277 | 11 |
| Trgovište | 16 | 16 | 7 | 261 | 12 |
| Mladenovac | 6 | 20 | 15 | 260 | 13 |
| Bogatić | 10 | 11 | 25 | 225 | 14 |
| Veliko Gradište | 7 | 18 | 20 | 214 | 15 |
| Rekovac | 19 | 13 | 11 | 204 | 16 |
| Kosjerić | 23 | 7 | 19 | 195 | 17 |
| Aleksandrovac | 24 | 14 | 10 | 187 | 18 |
| Aranđelovac | 17 | 22 | 9 | 178 | 19 |
| Blace | 22 | 15 | 12 | 152 | 20 |
| Vlasotince | 13 | 21 | 18 | 116 | 21 |
| Crna Trava | 15 | 17 | 21 | 101 | 22 |
| Vladimirci | 12 | 24 | 24 | 93 | 23 |
| Gadžin Han | 18 | 23 | 22 | 37 | 24 |
| Lebane | 21 | 25 | 23 | 13 | 25 |
Figure 3. Final vulnerability ranking map of the investigated local self-government units
4.3 Group-Specific Vulnerability Rankings
To obtain a more detailed understanding of vulnerability patterns, additional Fuzzy MULTIMOORA analyses were conducted separately for Groups A, B, and C. The three subordinate rankings within each group were aggregated using the same DDG procedure applied in the integrated assessment, ensuring methodological consistency between the group-specific and overall rankings. These analyses enabled the identification of LSGUs that perform differently across the environmental and demographic dimensions of vulnerability (Table 11).
| Local self-government unit | Final rank by group A criteria | Final rank by group B criteria | Final rank by group C criteria | Final rank by all criteria (A, B, C) |
|---|---|---|---|---|
| Ljubovija | 2 | 1 | 21 | 1 |
| Vladičin Han | 7 | 3 | 16 | 2 |
| Krupanj | 5 | 4 | 19 | 3 |
| Lazarevac | 1 | 2 | 24 | 4 |
| Mionica | 4 | 6 | 9 | 5 |
| Svilajnac | 3 | 8 | 8 | 6 |
| Arilje | 10 | 5 | 23 | 7 |
| Golubac | 16 | 7 | 4 | 8 |
| Velika Plana | 6 | 9 | 10 | 9 |
| Osečina | 9 | 12 | 5 | 10 |
| Topola | 13 | 13 | 17 | 11 |
| Trgovište | 17 | 10 | 25 | 12 |
| Mladenovac | 11 | 11 | 18 | 13 |
| Bogatić | 8 | 15 | 20 | 14 |
| Veliko Gradište | 15 | 14 | 6 | 15 |
| Rekovac | 18 | 20 | 3 | 16 |
| Kosjerić | 19 | 17 | 15 | 17 |
| Aleksandrovac | 14 | 19 | 7 | 18 |
| Aranđelovac | 12 | 16 | 22 | 19 |
| Blace | 20 | 18 | 12 | 20 |
| Vlasotince | 22 | 21 | 13 | 21 |
| Crna Trava | 24 | 23 | 1 | 22 |
| Vladimirci | 21 | 22 | 11 | 23 |
| Gadžin Han | 23 | 24 | 2 | 24 |
| Lebane | 25 | 25 | 14 | 25 |
The Group A ranking, representing the overall natural hazard exposure, identified the LSGUs characterized by extensive hazard-prone areas regardless of population distribution. The Group B ranking emphasized the LSGUs in which hazards directly affect built-up areas, settlements, and infrastructure. Finally, the Group C ranking reflected demographic vulnerability arising from population ageing, disability, economic inactivity, educational disadvantages, and elderly single-person households.
Comparison of the group-specific rankings reveals substantial differences among the analyzed LSGUs. Several units that achieved high positions in the demographic vulnerability ranking occupied considerably lower positions in the integrated ranking, indicating that unfavorable demographic characteristics alone do not necessarily result in high overall vulnerability. Conversely, high integrated vulnerability was generally associated with pronounced hazard-related exposure, while the simultaneous presence of demographic vulnerability further intensified the cumulative vulnerability of particular LSGUs. These findings indicate that overall vulnerability is shaped by the interaction of environmental and demographic dimensions, rather than by any single dimension considered independently.
The comparison of the group-specific and integrated rankings provides further insight into the different pathways through which high vulnerability may emerge. Ljubovija ranked second in Group A and first in Group B, but only twenty-first in Group C. Its first position in the integrated ranking therefore primarily reflects pronounced natural hazard exposure, particularly the exposure of built-up areas. A similar pattern can be observed for Lazarevac, which ranked first in Group A and second in Group B, but only twenty-fourth in Group C. Krupanj also achieved high positions in both hazard-related rankings, ranking fifth in Group A and fourth in Group B, while occupying nineteenth position in Group C. These cases demonstrate that pronounced hazard exposure may result in high integrated vulnerability even when demographic vulnerability is comparatively less pronounced.
Vladičin Han, which occupied the second position in the integrated ranking, also demonstrates the importance of hazard-related exposure. It ranked seventh in Group A and third in Group B, compared with sixteenth in Group C. Its particularly high position in the built-up area exposure ranking indicates that the spatial intersection between hazard-prone areas and settlements or infrastructure makes an important contribution to its overall vulnerability.
In contrast, Crna Trava and Gadžin Han achieved the first and second positions in the demographic vulnerability ranking but remained near the bottom of the integrated ranking. Crna Trava ranked twenty-fourth in Group A and twenty-third in Group B and consequently occupied the twenty-second position overall. Similarly, Gadžin Han ranked twenty-third in Group A and twenty-fourth in Group B and occupied the twenty-fourth position in the integrated assessment. These results demonstrate that severe demographic vulnerability represents an important but insufficient condition for high integrated vulnerability when hazard-related exposure remains comparatively limited.
Mionica and Svilajnac provide clearer examples of cumulative vulnerability resulting from the simultaneous contribution of environmental and demographic dimensions. Mionica ranked fourth in Group A, sixth in Group B, and ninth in Group C, resulting in the fifth integrated position. Similarly, Svilajnac ranked third in Group A, eighth in Group B, and eighth in Group C and occupied the sixth position overall. Unlike the predominantly hazard-driven vulnerability observed for several of the highest-ranked LSGUs, these two cases demonstrate how relatively unfavorable positions across all three dimensions can jointly contribute to high integrated vulnerability.
The group-specific analysis therefore reveals that LSGUs may follow distinct vulnerability pathways. Some are primarily characterized by pronounced environmental exposure, whereas others exhibit substantial demographic vulnerability without correspondingly high hazard exposure. A third pattern is represented by the LSGUs in which elevated hazard exposure coincides with comparatively unfavorable demographic conditions. These findings reinforce the multidimensional interpretation of vulnerability and demonstrate the importance of considering both environmental exposure and demographic susceptibility when assessing local vulnerability to natural hazards.
4.4 Sensitivity Analysis Results
To assess the robustness of the integrated vulnerability ranking to the changes in the weighting structure, a sensitivity analysis was performed by progressively increasing the cumulative weight assigned to Group C (demographic vulnerability). Three alternative scenarios were examined, in which the baseline weight of Group C was increased by 10%, 20%, and 30%. The weights assigned to Groups A and B were proportionally reduced to maintain a total group weight of 1, while the local weights of individual criteria within each group remained unchanged. For each scenario, the global criterion weights were recalculated and the complete Fuzzy MULTIMOORA procedure was repeated, followed by DDG aggregation of the three subordinate rankings.
The sensitivity analysis demonstrated a high degree of stability of the integrated vulnerability ranking. Spearman’s rank correlation coefficients between the baseline ranking and the rankings obtained under the alternative weighting scenarios were 0.9977, 0.9977, and 0.9892 for the +10%, +20%, and +30% Group C scenarios. These values indicate a very strong correspondence between the baseline and alternative rankings, even when the relative importance of demographic vulnerability was substantially increased.
The stability of the highest-ranked LSGUs was particularly pronounced. The composition of both the Top-5 and Top-10 remained unchanged across all three sensitivity scenarios, although minor changes in the order of individual LSGUs occurred within these groups. The maximum absolute rank change was limited to one position in both the +10% and +20% scenarios and to three positions in the +30% scenario.
Overall, the results indicate that the integrated vulnerability ranking is not highly sensitive to moderate changes in the relative importance assigned to demographic vulnerability. Even under the most pronounced weighting modification considered (+30% for Group C), the general ranking structure and the composition of the highest-ranked LSGUs remained stable. These findings support the robustness of the integrated assessment and indicate that the principal ranking patterns are not dependent on small or moderate variations in the FAHP-derived group weights.
5 Discussion
The results of this study demonstrate that vulnerability to natural hazards at the local level cannot be adequately understood through the analysis of environmental or demographic factors considered separately. Instead, the findings indicate that vulnerability emerges through an interaction of multiple dimensions, including natural hazard exposure, hazard exposure within built-up areas, and demographic characteristics of the affected population. This conclusion is consistent with contemporary vulnerability frameworks that conceptualize disaster risk as a product of interactions among hazards, exposure, and vulnerability, rather than as a consequence of any single component (Adger, 2006; Birkmann, 2006; UNDRR, 2015).
One of the most important findings of the study is the prominent role of hazard exposure within built-up areas. The Triangular Fuzzy AHP analysis assigned the highest importance to the indicators describing the exposure of settlements, infrastructure, and developed land to natural hazards. This suggests that the societal consequences of hazardous events are strongly influenced by their spatial interaction with human activities and built environments, rather than by the territorial extent of hazard-prone areas alone. This finding is consistent with previous studies emphasizing that disaster impacts are strongly influenced by the spatial coincidence of hazards and exposed elements, including population, housing, infrastructure, and economic assets (Cutter et al., 2003; Rashed & Weeks, 2003). Municipalities characterized by extensive hazard-prone areas do not necessarily experience severe impacts, if those hazards occur predominantly outside the populated and developed zones. Conversely, relatively limited hazard-prone areas may generate substantial vulnerability when they overlap with the settlements and critical infrastructure. The elevated importance of Group B indicators therefore highlights the necessity of incorporating built-up area exposure into local vulnerability assessments and disaster risk reduction planning. Such indicators provide a more realistic representation of potential societal impacts than hazard occurrence alone.
The group-specific and integrated rankings further demonstrate that high vulnerability may emerge through different pathways. Ljubovija, Vladičin Han, Krupanj, and Lazarevac are characterized primarily by pronounced hazard-related exposure, particularly within built-up areas, while their demographic vulnerability is comparatively less pronounced. Their high integrated positions therefore reflect the dominant contribution of environmental exposure, rather than uniformly unfavorable conditions across all dimensions. In contrast, Mionica and Svilajnac illustrate a more cumulative vulnerability pattern, as both occupy relatively high positions in all three group-specific rankings. These differences indicate that similar integrated vulnerability levels may result from different combinations of underlying environmental and demographic conditions.
The results also demonstrate that demographic vulnerability and hazard exposure do not necessarily coincide spatially. This is particularly evident in Crna Trava and Gadžin Han, which occupied the first and second positions in the demographic vulnerability ranking, but remained near the bottom of the integrated ranking. These municipalities are characterized by pronounced demographic ageing and other unfavorable demographic conditions that may reduce adaptive capacity and increase susceptibility to adverse impacts during and after hazardous events (Cutter & Finch, 2008; Fekete, 2009; Wisner et al., 2014). However, their comparatively limited exposure to the analyzed natural hazards, particularly within built-up areas, substantially reduced their integrated vulnerability.
This finding suggests that demographic vulnerability should be regarded as an important but not sufficient condition for high integrated vulnerability. Unfavorable demographic characteristics may increase susceptibility and reduce the capacity of communities to prepare for, respond to, and recover from hazardous events, but their influence becomes particularly important when combined with substantial hazard exposure. Assessments focusing exclusively on demographic characteristics may therefore overestimate overall vulnerability in areas with limited exposure, whereas approaches based exclusively on hazard exposure may fail to identify communities whose demographic structure constrains their adaptive and response capacities.
The observed patterns should also be interpreted within the broader context of demographic change in Serbia. Like many countries in Southeast Europe, Serbia has experienced long-term population ageing, declining fertility, out-migration, and depopulation. These processes have produced substantial demographic transformations, particularly in peripheral and rural municipalities. The comparatively limited differentiation of demographic vulnerability among many of the analyzed LSGUs may reflect the widespread nature of these processes. Population ageing, economic inactivity, household fragmentation, and demographic decline affect numerous Serbian municipalities regardless of their geographic location, whereas natural hazard exposure exhibits considerably stronger spatial differentiation.
Similar demographic trajectories have been documented across numerous European regions experiencing population decline and rural shrinkage (Newsham & Rowe, 2023). Shrinking regions may face reductions in human capital, weakened social networks, declining service availability, and diminished institutional capacities, all of which may influence their ability to cope with natural hazards. Municipalities such as Crna Trava, Gadžin Han, and Lebane represent examples of local communities affected by long-term demographic decline. Although they did not achieve high integrated vulnerability ranks in the present assessment, their demographic characteristics may indicate reduced adaptive capacity and potential challenges in emergency response and post-disaster recovery. The importance of ageing populations is further emphasized by recent studies demonstrating the heightened vulnerability of older adults to disasters and climate-related environmental stressors due to the interaction of health limitations, reduced mobility, social conditions, and dependence on support systems (United Nations, 2024; Tipaldo et al., 2024; Esendemir et al., 2025). These considerations reinforce the importance of retaining demographic indicators within integrated local vulnerability assessments even when they do not determine the highest overall ranks.
The contrasting vulnerability patterns identified among the analyzed LSGUs reinforce the multidimensional understanding of vulnerability proposed by contemporary disaster risk frameworks (Adger, 2006; Birkmann, 2006; UNDRR, 2015). The cases of Ljubovija, Vladičin Han, Krupanj, and Lazarevac demonstrate a predominantly hazard-driven pathway, whereas Mionica and Svilajnac illustrate a more cumulative interaction between environmental exposure and demographic vulnerability. Conversely, Crna Trava and Gadžin Han demonstrate that pronounced demographic vulnerability does not necessarily result in high integrated vulnerability when hazard exposure remains comparatively limited. Consequently, disaster risk reduction policies should be tailored to the specific vulnerability profiles of individual communities rather than relying on uniform approaches.
The additional Fuzzy MULTIMOORA analyses conducted separately for Groups A, B, and C proved particularly useful in identifying these patterns. By decomposing integrated vulnerability into its principal components, the analysis provided a more nuanced understanding of local vulnerability structures and enabled a clearer interpretation of ranking outcomes. The results provide strong support for H1 and additional support for H2, particularly in the cases of Mionica and Svilajnac, where elevated hazard exposure coincides with comparatively high demographic vulnerability. At the same time, the differences observed among the group-specific rankings indicate that the relationship between demographic vulnerability and overall vulnerability is neither uniform nor linear across the analyzed LSGUs.
The sensitivity analysis provides additional evidence regarding the robustness of the obtained rankings. Increasing the relative importance of Group C by 10%, 20%, and 30%, while proportionally reducing the weights assigned to Groups A and B, produced only limited changes in the integrated ranking. Spearman’s rank correlation coefficients between the baseline and alternative scenarios remained very high (ρ = 0.9977 for both the +10% and +20% scenarios and ρ = 0.9892 for the +30% scenario). Moreover, the composition of both the Top-5 and Top-10 remained unchanged in all scenarios. The maximum absolute rank change was only one position under the +10% and +20% scenarios and three positions under the +30% scenario. These results indicate that the principal ranking pattern is not highly sensitive to moderate changes in the relative importance assigned to demographic vulnerability and support the robustness of the integrated assessment.
Several limitations of the present study should nevertheless be acknowledged. First, the analysis was conducted on a sample of 25 local self-government units selected according to their territorial area. Consequently, the findings should not be interpreted as representative of all Serbian municipalities, but rather as an assessment of territorially comparable local units. Second, hazard indicators were derived from nationally available spatial datasets, and the assessment therefore depends on the spatial accuracy, resolution, and temporal characteristics of the source data. Third, the weighting procedure relies on the expert judgments incorporated through the Triangular Fuzzy AHP method. Although the consistency ratios obtained for all pairwise comparison matrices were below the accepted threshold of 0.10, supporting the internal consistency of the judgments, a degree of subjectivity remains inherent in expert-based weighting procedures. Fourth, the assessment was based on a limited set of demographic indicators determined partly by data availability at the LSGU level. Additional variables related to migration dynamics, income, health conditions, social capital, accessibility of services, and institutional capacities could provide further insight into local vulnerability patterns.
An additional limitation concerns the external validation of the integrated vulnerability ranking. Although information on past natural hazard events and their consequences exists for the analyzed LSGUs, these records are heterogeneous in terms of completeness, spatial precision, temporal coverage, and the procedures used for documenting impacts and losses. Consequently, direct comparison between the model results and historical disaster records would not provide a sufficiently consistent basis for systematic validation across all 25 LSGUs. Future research should therefore seek to integrate standardized and spatially explicit records of observed natural hazard events, damage, and affected populations with multidimensional vulnerability assessments such as the one proposed here. Such an approach would enable more rigorous evaluation of the relationship between modeled vulnerability and observed disaster consequences.
Despite these limitations, the proposed GIS-based Triangular Fuzzy AHP–Fuzzy MULTIMOORA framework provides a systematic means of integrating heterogeneous environmental and demographic information. The combination of group-specific and integrated analyses is particularly useful because it allows the final ranking to be interpreted in terms of the different processes contributing to vulnerability, rather than treating vulnerability as a single undifferentiated score. The robustness demonstrated by the sensitivity analysis further supports the usefulness of the framework for comparative assessment and prioritization, while the identified limitations indicate directions in which future applications may be expanded and empirically validated.
6 Conclusion
This study examined the interaction between natural hazard exposure and demographic vulnerability across 25 Serbian local self-government units (LSGUs) through the integration of Geographic Information Systems (GIS), the Triangular Fuzzy Analytic Hierarchy Process (FAHP), and the Fuzzy MULTIMOORA method. By combining environmental and demographic indicators within a unified analytical framework, the study provides a more comprehensive understanding of local vulnerability patterns and their implications for disaster risk reduction.
The results indicate that vulnerability cannot be adequately explained by either natural hazard exposure or demographic characteristics considered independently. Instead, overall vulnerability emerges through the interaction of multiple dimensions, including hazard occurrence, exposure of built-up areas, and demographic structure. The weighting procedure revealed the prominent importance of indicators describing hazard exposure within built-up areas, suggesting that the potential consequences of natural hazards are strongly influenced by their spatial coincidence with settlements, infrastructure, and population rather than by the territorial extent of hazard-prone areas alone.
The integrated Fuzzy MULTIMOORA ranking identified Ljubovija, Vladičin Han, and Krupanj as the most vulnerable municipalities among the analyzed LSGUs, whereas Lebane, Gadžin Han, and Vladimirci occupied the lowest positions. However, the group-specific analyses demonstrated that high demographic vulnerability does not necessarily correspond to high integrated vulnerability. Municipalities such as Crna Trava and Gadžin Han exhibited pronounced demographic disadvantages but comparatively lower hazard-related exposure. In contrast, Mionica and Svilajnac represent clearer examples of cumulative vulnerability, as relatively high vulnerability across all three dimensions contributed to their fifth and sixth integrated positions.
The separate analyses of Groups A, B, and C provided additional insight into the different pathways through which local vulnerability may emerge. Some LSGUs were primarily characterized by environmental exposure, others by demographic disadvantages, while cumulative vulnerability resulted from the simultaneous contribution of environmental and demographic dimensions. The findings provide strong support for H1 and additional support for H2, particularly in the cases where elevated hazard exposure coincides with comparatively high demographic vulnerability. This reinforces the importance of considering hazard-related exposure and demographic susceptibility within an integrated assessment framework.
The sensitivity analysis further demonstrated the robustness of the integrated ranking to changes in the relative importance assigned to demographic vulnerability. The very high rank correlations across all tested scenarios, together with the unchanged composition of the Top-5 and Top-10 LSGUs, indicate that the principal vulnerability pattern remains stable under moderate modifications of the weighting structure.
From a practical perspective, the findings emphasize the importance of incorporating demographic considerations into local disaster risk reduction strategies. Population ageing, economic inactivity, disability, educational disadvantages, and household structure should be considered alongside environmental hazards when prioritizing preventive measures, allocating resources, and strengthening local resilience. The proposed GIS–FAHP–Fuzzy MULTIMOORA–DDG framework provides a transparent comparative approach that may support such evidence-based decision-making.
Future research should extend the analysis to a larger number of Serbian LSGUs, incorporate additional socioeconomic and institutional indicators, and examine temporal changes in both demographic vulnerability and natural hazard exposure. Particular attention should also be devoted to empirical validation through the integration of systematically documented data on past hazard events, their consequences, and affected populations. Such developments could further strengthen the applicability of the proposed framework for disaster risk reduction and population protection at local, regional, and national levels.
This research was supported by the Science Fund of the Republic of Serbia, Project ID: 7358, POPENVIROS – “Population Dynamics under Environmental Challenges in Serbia”, as well as within the framework of the SRO (University of Belgrade – Faculty of Geography) funded by the Ministry of Science, Technological Development and Innovation for 2026 [contract number 451-03-34/2026-03/ 200091].
Data availability statement
The data used in this study are publicly available from the Spatial Plan of the Republic of Serbia 2021–2035 and the 2022 Population Census conducted by the Statistical Office of the Republic of Serbia. The processed datasets generated during the current study are available from the corresponding author upon reasonable request.
References
- Adger, W. N. (2006). Vulnerability. Global Environmental Change, 16(3), 268-281. https://doi.org/10.1016/j.gloenvcha.2006.02.006
- Altuntas, S., Dereli, T., & Yılmaz, M. K. (2015). Evaluation of excavator technologies: application of data fusion based MULTIMOORA methods. Journal of Civil Engineering and Management, 21(8), 977-997. https://doi.org/10.3846/13923730.2015.1064468
- Birkmann, J. (Ed.). (2006). Measuring Vulnerability to Natural Hazards: Towards Disaster Resilient Societies. United Nations University Press. https://archive.unu.edu/unupress/2006/measuringVulnerability.html
- Brauers, W. K. M., & Zavadskas, E. K. (2006). The MOORA method and its application to privatization in a transition economy. Control and Cybernetics, 35(2), 445-469. https://eudml.org/doc/209425
- Brauers, W. K. M., & Zavadskas, E. K. (2010). Project management by MULTIMOORA as an instrument for transition economies. Technological and Economic Development of Economy, 16(1), 5-24. https://doi.org/10.3846/tede.2010.01
- Buckley, J. J. (1985). Fuzzy hierarchical analysis. Fuzzy Sets and Systems, 17(3), 233-247. https://doi.org/10.1016/0165-0114(85)90090-9
- Chang, D.-Y. (1996). Applications of the extent analysis method on fuzzy AHP. European Journal of Operational Research, 95(3), 649-655. https://doi.org/10.1016/0377-2217(95)00300-2
- Clar, C. (2019). How demographic developments determine the management of hydrometeorological hazard risks in rural communities: The linkages between demographic and natural hazards research. WIREs Water, 6, e1378. https://doi.org/10.1002/wat2.1378
- Clar, C., Löschner, L., Nordbeck, R., Fischer, T., & Thaler, T. (2020). Population dynamics and natural hazard risk management: conceptual and practical linkages for the case of Austrian policy making. Natural Hazards, 105(2), 1765-1796. https://doi.org/10.1007/s11069-020-04376-z
- Cutter, S. L., & Finch, C. (2008). Temporal and spatial changes in social vulnerability to natural hazards. Proceedings of the National Academy of Sciences, 105(7), 2301-2306. https://doi.org/10.1073/pnas.0710375105
- Cutter, S. L., Boruff, B. J., & Shirley, W. L. (2003). Social vulnerability to environmental hazards. Social Science Quarterly, 84(2), 242-261. https://doi.org/10.1111/1540-6237.8402002
- Cvetković, V. M., Milenković, D., & Lukić, T. (2026). Measuring Community Disaster Resilience in Serbia Using an Adapted BRIC Framework Grounded in DROP: Index Construction and Regional Disparities. Geosciences, 16(4). https://doi.org/10.3390/geosciences16040135
- Dragicevic, S., Filipovic, D., Kostadinov, S., Ristic, R., Novkovic, I., Zivkovic, N., Andjelkovic, G., Abolmasov, B., Secerov, V., & Djurdjic, S. (2011). Natural hazard assessment for land-use planning in Serbia. International Journal of Environmental Research, 5(2), 371-380. https://doi.org/10.22059/ijer.2011.322
- Esendemir, Ş., Çatıkkaş, N. M., & Karan, M. A. (2025). “Get Ready!” The vulnerability and resilience of older adults in disasters. European Journal of Geriatrics and Gerontology, 7(1), 29-36. https://doi.org/10.4274/ejgg.galenos.2025.2024-8-3
- Fekete, A. (2009). Validation of a social vulnerability index in context to river floods in Germany. Natural Hazards and Earth System Sciences, 9(2), 393-403. https://doi.org/10.5194/nhess-9-393-2009
- Intergovernmental Panel on Climate Change (IPCC). (2022). Climate Change 2022 – Impacts, Adaptation and Vulnerability. Cambridge University Press. https://doi.org/10.1017/9781009325844
- Malczewski, J. (1999). GIS and Multicriteria Decision Analysis. John Wiley & Sons. https://www.wiley-vch.de/en/areas-interest/natural-sciences/gis-and-multicriteria-decision-analysis-978-0-471-32944-2
- Malczewski, J. (2006). GIS‐based multicriteria decision analysis: a survey of the literature. International Journal of Geographical Information Science, 20(7), 703-726. https://doi.org/10.1080/13658810600661508
- Malinić, V., Durlević, U., Brašanac-Bosanac, L., Novković, I., Joksimović, M., Golić, R., & Krstić, F. (2025). A Hybrid Fuzzy AHP-MULTIMOORA Approach for Solar Energy Development on Rural Brownfield Sites in Serbia. Sustainability, 17(17). https://doi.org/10.3390/su17177988
- Ministry of Construction, Transport and Infrastructure of the Republic of Serbia. (2021). Spatial Plan of the Republic of Serbia 2021-2035: Draft. https://www.mgsi.gov.rs/sites/default/files/PPRS%20Nacrt.pdf
- Newsham, N., & Rowe, F. (2022). Understanding trajectories of population decline across rural and urban Europe: A sequence analysis. Population, Space and Place, 29(3), e2630. https://doi.org/10.1002/psp.2630
- Novkovic, I., Markovic, G. B., Lukic, D., Dragicevic, S., Milosevic, M., Djurdjic, S., Samardzic, I., Lezaic, T., & Tadic, M. (2021). GIS-Based Forest Fire Susceptibility Zonation with IoT Sensor Network Support, Case Study—Nature Park Golija, Serbia. Sensors, 21(19). https://doi.org/10.3390/s21196520
- Novković, I., Šećerov, V., & Filipović, D. (2024). Application of Fuzzy Logic in the Analysis of Sustainable Development Indicators. In B. Stojkov & M. Pantić (Eds.), Sustainable development : the vector of Serbia to the future (pp. 231-246). Institute of Architecture and Urban & Spatial Planning of Serbia. https://doi.org/10.46793/82154-04-4.231n
- Rashed, T., & Weeks, J. (2003). Assessing vulnerability to earthquake hazards through spatial multicriteria analysis of urban areas. International Journal of Geographical Information Science, 17(6), 547-576. https://doi.org/10.1080/1365881031000114071
- Runkler, T. A. (1997). Selection of appropriate defuzzification methods using application specific properties. IEEE Transactions on Fuzzy Systems, 5(1), 72-79. https://doi.org/10.1109/91.554449
- Saaty, T. L. (1980). The Analytic Hierarchy Process: Planning, Priority Setting, Resource Allocation. McGraw-Hill. https://openlibrary.org/books/OL4425444M/The_analytic_hierarchy_process
- Statistical Office of the Republic of Serbia. (2023). 2022 Census of Population, Households and Dwellings in the Republic of Serbia. https://www.stat.gov.rs/en-us/vesti/20230428-konacnirezpopisa/?a=0&s=130002
- Tipaldo, J. F., Balk, D., & Hunter, L. M. (2024). A framework for ageing and health vulnerabilities in a changing climate. Nature Climate Change, 14(11), 1125-1135. https://doi.org/10.1038/s41558-024-02156-2
- United Nations. (2024). World Population Ageing 2023. United Nations Department of Economic and Social Affairs. https://www.un.org/development/desa/pd/content/world-population-ageing-2023
- United Nations Office for Disaster Risk Reduction (UNDRR). (2015). Sendai Framework for Disaster Risk Reduction 2015-2030. https://www.undrr.org/publication/sendai-framework-disaster-risk-reduction-2015-2030
- Vadrevu, K. P., Eaturu, A., & Badarinath, K. V. S. (2009). Fire risk evaluation using multicriteria analysis—a case study. Environmental Monitoring and Assessment, 166(1-4), 223-239. https://doi.org/10.1007/s10661-009-0997-3
- Wang, Y.-M., Luo, Y., & Hua, Z. (2008). On the extent analysis method for fuzzy AHP and its applications. European Journal of Operational Research, 186(2), 735-747. https://doi.org/10.1016/j.ejor.2007.01.050
- Wisner, B., Gaillard, J. C., … Kelman, I. (Eds.). (2014). Handbook of Hazards and Disaster Risk Reduction. Routledge. https://doi.org/10.4324/9780203844236
- Zadeh, L. A. (1965). Fuzzy sets. Information and Control, 8(3), 338-353. https://doi.org/10.1016/S0019-9958(65)90241-X
Article Details
Published by the Institute of Social Sciences - Center for Demographic Research




References
Adger, W. N. (2006). Vulnerability. Global Environmental Change, 16(3), 268-281. https://doi.org/10.1016/j.gloenvcha.2006.02.006 DOI: https://doi.org/10.1016/j.gloenvcha.2006.02.006
Altuntas, S., Dereli, T., & Yılmaz, M. K. (2015). Evaluation of excavator technologies: application of data fusion based MULTIMOORA methods. Journal of Civil Engineering and Management, 21(8), 977-997. https://doi.org/10.3846/13923730.2015.1064468 DOI: https://doi.org/10.3846/13923730.2015.1064468
Birkmann, J. (Ed.). (2006). Measuring Vulnerability to Natural Hazards: Towards Disaster Resilient Societies. United Nations University Press. https://archive.unu.edu/unupress/2006/measuringVulnerability.html
Brauers, W. K. M., & Zavadskas, E. K. (2006). The MOORA method and its application to privatization in a transition economy. Control and Cybernetics, 35(2), 445-469. https://eudml.org/doc/209425
Brauers, W. K. M., & Zavadskas, E. K. (2010). Project management by MULTIMOORA as an instrument for transition economies. Technological and Economic Development of Economy, 16(1), 5-24. https://doi.org/10.3846/tede.2010.01 DOI: https://doi.org/10.3846/tede.2010.01
Buckley, J. J. (1985). Fuzzy hierarchical analysis. Fuzzy Sets and Systems, 17(3), 233-247. https://doi.org/10.1016/0165-0114(85)90090-9 DOI: https://doi.org/10.1016/0165-0114(85)90090-9
Chang, D.-Y. (1996). Applications of the extent analysis method on fuzzy AHP. European Journal of Operational Research, 95(3), 649-655. https://doi.org/10.1016/0377-2217(95)00300-2 DOI: https://doi.org/10.1016/0377-2217(95)00300-2
Clar, C. (2019). How demographic developments determine the management of hydrometeorological hazard risks in rural communities: The linkages between demographic and natural hazards research. WIREs Water, 6, e1378. https://doi.org/10.1002/wat2.1378 DOI: https://doi.org/10.1002/wat2.1378
Clar, C., Löschner, L., Nordbeck, R., Fischer, T., & Thaler, T. (2020). Population dynamics and natural hazard risk management: conceptual and practical linkages for the case of Austrian policy making. Natural Hazards, 105(2), 1765-1796. https://doi.org/10.1007/s11069-020-04376-z DOI: https://doi.org/10.1007/s11069-020-04376-z
Cutter, S. L., & Finch, C. (2008). Temporal and spatial changes in social vulnerability to natural hazards. Proceedings of the National Academy of Sciences, 105(7), 2301-2306. https://doi.org/10.1073/pnas.0710375105 DOI: https://doi.org/10.1073/pnas.0710375105
Cutter, S. L., Boruff, B. J., & Shirley, W. L. (2003). Social vulnerability to environmental hazards. Social Science Quarterly, 84(2), 242-261. https://doi.org/10.1111/1540-6237.8402002 DOI: https://doi.org/10.1111/1540-6237.8402002
Cvetković, V. M., Milenković, D., & Lukić, T. (2026). Measuring Community Disaster Resilience in Serbia Using an Adapted BRIC Framework Grounded in DROP: Index Construction and Regional Disparities. Geosciences, 16(4). https://doi.org/10.3390/geosciences16040135 DOI: https://doi.org/10.3390/geosciences16040135
Dragicevic, S., Filipovic, D., Kostadinov, S., Ristic, R., Novkovic, I., Zivkovic, N., Andjelkovic, G., Abolmasov, B., Secerov, V., & Djurdjic, S. (2011). Natural hazard assessment for land-use planning in Serbia. International Journal of Environmental Research, 5(2), 371-380. https://doi.org/10.22059/ijer.2011.322
Esendemir, Ş., Çatıkkaş, N. M., & Karan, M. A. (2025). “Get Ready!” The vulnerability and resilience of older adults in disasters. European Journal of Geriatrics and Gerontology, 7(1), 29-36. https://doi.org/10.4274/ejgg.galenos.2025.2024-8-3 DOI: https://doi.org/10.4274/ejgg.galenos.2025.2024-8-3
Fekete, A. (2009). Validation of a social vulnerability index in context to river floods in Germany. Natural Hazards and Earth System Sciences, 9(2), 393-403. https://doi.org/10.5194/nhess-9-393-2009 DOI: https://doi.org/10.5194/nhess-9-393-2009
Intergovernmental Panel on Climate Change (IPCC). (2022). Climate Change 2022 – Impacts, Adaptation and Vulnerability. Cambridge University Press. https://doi.org/10.1017/9781009325844 DOI: https://doi.org/10.1017/9781009325844
Malczewski, J. (1999). GIS and Multicriteria Decision Analysis. John Wiley & Sons. https://www.wiley-vch.de/en/areas-interest/natural-sciences/gis-and-multicriteria-decision-analysis-978-0-471-32944-2
Malczewski, J. (2006). GIS‐based multicriteria decision analysis: a survey of the literature. International Journal of Geographical Information Science, 20(7), 703-726. https://doi.org/10.1080/13658810600661508 DOI: https://doi.org/10.1080/13658810600661508
Malinić, V., Durlević, U., Brašanac-Bosanac, L., Novković, I., Joksimović, M., Golić, R., & Krstić, F. (2025). A Hybrid Fuzzy AHP-MULTIMOORA Approach for Solar Energy Development on Rural Brownfield Sites in Serbia. Sustainability, 17(17). https://doi.org/10.3390/su17177988 DOI: https://doi.org/10.3390/su17177988
Ministry of Construction, Transport and Infrastructure of the Republic of Serbia. (2021). Spatial Plan of the Republic of Serbia 2021-2035: Draft. https://www.mgsi.gov.rs/sites/default/files/PPRS%20Nacrt.pdf
Newsham, N., & Rowe, F. (2022). Understanding trajectories of population decline across rural and urban Europe: A sequence analysis. Population, Space and Place, 29(3), e2630. https://doi.org/10.1002/psp.2630 DOI: https://doi.org/10.1002/psp.2630
Novkovic, I., Markovic, G. B., Lukic, D., Dragicevic, S., Milosevic, M., Djurdjic, S., Samardzic, I., Lezaic, T., & Tadic, M. (2021). GIS-Based Forest Fire Susceptibility Zonation with IoT Sensor Network Support, Case Study—Nature Park Golija, Serbia. Sensors, 21(19). https://doi.org/10.3390/s21196520 DOI: https://doi.org/10.3390/s21196520
Novković, I., Šećerov, V., & Filipović, D. (2024). Application of Fuzzy Logic in the Analysis of Sustainable Development Indicators. In B. Stojkov & M. Pantić (Eds.), Sustainable development : the vector of Serbia to the future (pp. 231-246). Institute of Architecture and Urban & Spatial Planning of Serbia. https://doi.org/10.46793/82154-04-4.231n DOI: https://doi.org/10.46793/82154-04-4.231N
Rashed, T., & Weeks, J. (2003). Assessing vulnerability to earthquake hazards through spatial multicriteria analysis of urban areas. International Journal of Geographical Information Science, 17(6), 547-576. https://doi.org/10.1080/1365881031000114071 DOI: https://doi.org/10.1080/1365881031000114071
Runkler, T. A. (1997). Selection of appropriate defuzzification methods using application specific properties. IEEE Transactions on Fuzzy Systems, 5(1), 72-79. https://doi.org/10.1109/91.554449 DOI: https://doi.org/10.1109/91.554449
Saaty, T. L. (1980). The Analytic Hierarchy Process: Planning, Priority Setting, Resource Allocation. McGraw-Hill. https://openlibrary.org/books/OL4425444M/The_analytic_hierarchy_process
Statistical Office of the Republic of Serbia. (2023). 2022 Census of Population, Households and Dwellings in the Republic of Serbia. https://www.stat.gov.rs/en-us/vesti/20230428-konacnirezpopisa/?a=0&s=130002
Tipaldo, J. F., Balk, D., & Hunter, L. M. (2024). A framework for ageing and health vulnerabilities in a changing climate. Nature Climate Change, 14(11), 1125-1135. https://doi.org/10.1038/s41558-024-02156-2 DOI: https://doi.org/10.1038/s41558-024-02156-2
United Nations. (2024). World Population Ageing 2023. United Nations Department of Economic and Social Affairs. https://www.un.org/development/desa/pd/content/world-population-ageing-2023
United Nations Office for Disaster Risk Reduction (UNDRR). (2015). Sendai Framework for Disaster Risk Reduction 2015-2030. https://www.undrr.org/publication/sendai-framework-disaster-risk-reduction-2015-2030
Vadrevu, K. P., Eaturu, A., & Badarinath, K. V. S. (2009). Fire risk evaluation using multicriteria analysis—a case study. Environmental Monitoring and Assessment, 166(1-4), 223-239. https://doi.org/10.1007/s10661-009-0997-3 DOI: https://doi.org/10.1007/s10661-009-0997-3
Wang, Y.-M., Luo, Y., & Hua, Z. (2008). On the extent analysis method for fuzzy AHP and its applications. European Journal of Operational Research, 186(2), 735-747. https://doi.org/10.1016/j.ejor.2007.01.050 DOI: https://doi.org/10.1016/j.ejor.2007.01.050
Wisner, B., Gaillard, J. C., … Kelman, I. (Eds.). (2014). Handbook of Hazards and Disaster Risk Reduction. Routledge. https://doi.org/10.4324/9780203844236 DOI: https://doi.org/10.4324/9780203844236
Zadeh, L. A. (1965). Fuzzy sets. Information and Control, 8(3), 338-353. https://doi.org/10.1016/S0019-9958(65)90241-X DOI: https://doi.org/10.1016/S0019-9958(65)90241-X