
Social inclusion of Roma through active labor market policies in Serbia
Article Sidebar
Main Article Content
Abstract
Roma communities across Europe face persistent labor market exclusion, characterized by high unemployment, informal work, and limited access to formal employment. Despite numerous policy initiatives, evidence on the effectiveness of active labor market policies (ALMPs) targeting ethnic minorities remains scarce, largely due to the absence of ethnicity-disaggregated data. This paper evaluates the employment outcomes of a targeted ALMP program, "Inclusion of Roma and other Marginalized Groups in Serbia", implemented by German Development Cooperation in support of the National Strategy for Social Inclusion of Roma in Serbia 2016–2025. The program provided vocational training, practical skills acquisition, and self-employment subsidies to Roma and returnees facing multiple barriers to labor market participation. Using data from an endline survey of 350 program participants conducted on average 14 months after registration, the paper examines changes in employment status, sectoral employment patterns, job quality, and participant satisfaction. The results show a substantial increase in employment — from 23.4% before the program to 65.2% after participation. The largest employment gains were recorded in industry (+48.2 percentage points), followed by other sectors (+46.4 p.p.), self-employment (+33.5 p.p.), and services (+27.2 p.p.). Most participants expressed satisfaction with the program: 78.6% received certificates and 63.3% found the acquired skills useful. However, job quality improvements remained limited, only 18% of those employed held permanent contracts and just 11.4% reported increased earnings attributable to the program. Regression analysis indicates that educational attainment was the strongest predictor of post-program employment, while gender and returnee status showed no significant effect. The findings suggest that ALMPs can be an effective tool for promoting labor market inclusion of highly marginalized populations, but sustained improvements in job quality and earnings require complementary investments in formal education and demand-side policies.
1 Introduction
Social inclusion is the capacity of individuals and groups to participate fully and equally in society, with equitable access to opportunities and rights, irrespective of their socio-economic background. It is a multidimensional concept that spans key domains such as education, healthcare, housing, and employment. Across these dimensions, Roma population, an ethnic minority in many European countries, consistently lags behind majority populations (European Union Agency for Fundamental Rights, 2022). This study focuses specifically on the dimension of labor market inclusion.
Labor market participation and educational attainment among Roma are substantially lower than those in the majority population (Dinca & Luches, 2018). The Roma community as a whole experiences high unemployment rates, often leading to long-term unemployment and inactivity (Cahn & Guild, 2010). Discrimination and marginalization in the labor market have received much attention (Ullah et al., 2024; Simeunovic Bajic, 2011; Lebedinski, 2019; Lebedinski et al., 2025), as have the measures designed to facilitate Roma access to employment (Cace & Ionescu, 2006; O’Higgins, 2012).
Reliable data on formal employment are limited in many countries—including Serbia—because official statistics often under-represents marginalized populations. For Roma in particular, coverage is reduced when individuals choose not to self-identify in censuses and surveys, leading to systematic undercounting. When considering Roma self-identity, disparities are stark: unemployment rates are three times higher than in the general population (Stankovic, 2022). Occupational patterns within Roma communities often reflect precarious forms of work, including participation in the grey economy, informal labor, waste collection, traditional handicrafts, and seasonal or migrant agricultural work (Preoteasa, 2013). Informal work results in low and unstable incomes, with more than 70% of the employed Roma working without formal contracts or social insurance (Vidojević & Perišić, 2015). Indeed, a 2016 EU survey found that among the employed Roma, only “one in four” adults held formally paid employment (European Union Agency for Fundamental Rights, 2016). The survey data also indicate that a substantial share of working-age Roma have never held formal employment (Hyde, 2006).
Given these persistent challenges, breaking the cycle of poverty remains extremely difficult. In this context, active labor market policies (ALMPs) play a critical role in fostering inclusion. These policies aim to enhance employment opportunities, particularly for vulnerable groups such as the long-term unemployed, youth, women, persons with disabilities, and ethnic minorities—including Roma.
Although both strategies and action plans targeting Roma inclusion have been adopted over the last two decades, the practical results remain limited (European Commission, 2020; Vidojević & Perišić, 2015). Additional obstacles lie in institutions, social policies, and their often ineffective implementation. Rostas (2019) argues that the absence of direct Roma political influence and involvement in formulating policies of consequence to their community is a root cause of policy failure.
Furthermore, although many Eastern European countries, including Serbia, have formally recognized Roma exclusion and developed policy responses, institutional weaknesses and policy gaps remain a barrier. Evaluations frequently highlight the mismatch between policy aims and actual implementation. While numerous laws and strategies formally support Roma employment and anti-discrimination, bottlenecks arise from complex regulations, weak coordination, and insufficient local resources. Discrepancies between national commitments and local implementation further exacerbate these issues. The result is that “overall changes in the situation of Roma” remain limited and uneven (United Nations Development Programme [UNDP], 2015; European Commission, 2020). In Serbia, for example, multiple Roma integration strategies (e.g. the Strategy for Social Inclusion of Roma 2016–2025 in the Republic of Serbia, 2016) have been introduced at the national level to improve education, employment, health, and housing. Nevertheless, these initiatives have often fallen short of achieving even their minimal aims.
The lack of high-quality data on Roma represents another substantial barrier, as it constrains planning processes. While considerable knowledge exists regarding the effectiveness of ALMPs and the conditions influencing their success, significant gaps remain in understanding how these programs reach ethnic minority populations, particularly those at the highest risk of exclusion. Most evaluations lack the data necessary for incorporating ethnicity as a factor. Consequently, “good practice” approaches often substitute for data-driven evaluations concerning ethnic minorities, specifically Roma population. A more serious issue is the absence of ethnicity-disaggregated data during the design phase of programs. Even one of the most comprehensive studies on ethnic minority labor market integration in Europe, conducted by the Institute for the Study of Labor (IZA) (Kahanec & Zimmermann, 2010), relies primarily on expert opinions, rather than scarce empirical evidence on how labor market policies affect ethnic minorities.
Given these data constraints, this paper adopts an exploratory and descriptive approach. The analysis is based on a single endline survey of program participants and does not include a control or comparison group. As a result, the findings should be interpreted as associative rather than causal, and may be subject to recall bias, social desirability bias, and non-response bias. While this study cannot establish causal inference, it allows for an empirical examination of self-reported employment-related outcomes among the marginalized groups that are typically underrepresented in official data.
A further limitation concerns potential selection and endogeneity in the observed associations. Participation in the program and assignment to different measures are not random, and may reflect unobserved characteristics such as motivation, job search effort, local labor market conditions, or prior employability. These factors may be correlated with both observed covariates and employment outcomes, which implies that even the estimated associations may partly reflect unobserved heterogeneity rather than structural relationships. As a result, the findings should be interpreted as descriptive patterns within the sample of participants, rather than as generalizable behavioral relationships.
To address these challenges, this paper examines a program of ALMPs targeting Roma and returnees (among other vulnerable groups), implemented by German Development Cooperation. By engaging participants in ALMPs and providing skills development, the program seeks to reduce Roma labor market exclusion as one key dimension of social exclusion. This paper assesses the outcomes of this program for Roma and other vulnerable labor market groups, focusing on several aspects of participants’ work lives, including employability, income, and job security. Our findings contribute to the literature by evaluating the effects of targeted labor market interventions in the context of ethnic minorities and social exclusion.
The paper proceeds as follows: we begin with the country context, then describe the program and outline the methodology. We next present descriptive statistics and results, and conclude with a discussion of the findings.
2 Country context
The Roma are Europe’s largest ethnic minority (estimated at 10–12 million) (European Commission, 2020), forming a small but significant share of national populations. They tend to be poorer, less educated, to experience worse health outcomes, and face widespread discrimination. A 2021 survey by the EU Fundamental Rights Agency covering Roma in ten European countries found that 80% of Roma are at risk of poverty, a figure in stark contrast to the 17% poverty risk affecting the wider EU population (European Union Agency for Fundamental Rights, 2022).
According to the 2022 census, approximately 131,936 Roma live in Serbia (1.99% of the total population). However, the actual number is believed to be at least double, as many Roma choose not to openly identify as such, or have more than one identity. Roma in Serbia are particularly affected by low participation in early childhood education: only 17% of Roma children attend preschool, leaving the vast majority under-stimulated, undereducated, and unprepared for primary school (UNDP, 2018). Dropout rates remain high, with roughly 50% of Roma students leaving school by the fourth year of primary education (Vidojević & Perišić, 2015). As a result, more than one-third of young Roma adults (18–21) in Serbia have not completed compulsory basic education (UNDP, 2018).
The European Union Agency for Fundamental Rights (2022) survey found that in Serbia, 51% of Roma were in paid work in 2021, compared with 66% of the majority population. Gender disparities are striking: 73% of Roma men reported being engaged in paid work, versus only 30% of Roma women. The share of youth not in employment, education, or training (NEET) was 47% among Roma, compared with 16% in the majority population. Furthermore, about one in three Roma in Serbia reported experiencing discrimination when looking for work.
Several affirmative action policies have aimed to improve Roma labor market outcomes in Serbia. The Roma population is explicitly listed as one of the primary target groups in several measures of the National Employment Service (NES), including the Internship Program, Practical Skills Acquisition, Employment Subsidies for Disadvantaged Jobseekers, and Professional Traineeship. Data on Roma participation are regularly included in NES implementation reports. In addition, a number of civil society organizations (e.g. Roma Education Fund, Roma Social Inclusion Network, etc.) provide education and employment support tailored to the Roma population.
2.1 Program description
In this paper, we use the data from the program “Inclusion of Roma and other Marginalized Groups in Serbia” (InR), which was implemented in the Republic of Serbia with the aim of supporting the implementation of the National Strategy for Social Inclusion of Roma in Serbia 2016-2025. The main objective of the program was to improve the living conditions of Roma, returnees1 and other marginalized groups (e.g. people with disabilities, women in rural communities, etc.) in Serbia, focusing on their general human, economic, social and cultural rights. In order to achieve the intended goal, the intervention was divided into 5 areas:
(1) advisory support to the Ministry of Human and Minority Rights and Social Dialogue and the Coordination Unit for Monitoring the Implementation of the National Roma Strategy;
(2) financial support to local actors in the implementation of the Strategy;
(3) implementation of measures to improve the position of Roma and other marginalized groups in the labor market;
(4) implementation of measures to reduce stereotypes and discrimination
(5) support to local agencies in selected municipalities in addressing the economic challenges resulting from COVID-19.
The program placed particular emphasis on the economic inclusion of Roma and returnees, marginalized groups that face barriers to participating in economic activities. These barriers are reflected in unequal access to education and employment opportunities, with many individuals remaining economically inactive or engaged primarily in informal work. In addition to supporting the implementation of the strategy at the national and local level by facilitating cooperation, networking and providing both financial and non-financial systemic support for local inclusion measures, the program also included tailor-made measures to promote employment. As most of the target groups had multifaceted problems in finding an adequate job, the economic empowerment component of the program included the following active labor market measures based on the challenges reported by the beneficiaries, their current skills and their career aspirations:
- Vocational training for profiles that were in demand in the labor market (e.g. forklift operators, welders, caregivers, etc.);
- Practical training and employment with employers;
- Granting of subsidies for setting up their own business (e.g. hairdressers).
3 Methodology
The sampling frame for the survey consisted of all individuals who have participated in the training measures offered by the program. The sample was stratified by gender and returnee status; 855 participants (35.4% of the total 2,844) were randomly selected to be contacted. In the end, 350 individuals (12.4% of the total number of the participants) had been successfully reached and agreed to participate in the interview. Interviews were conducted by phone in three rounds. The main reasons for non-response (see Table 1) were incorrect or non-existent phone numbers (229 cases, or 26.8% of those contacted) and a lack of response (112 cases, or 13.1%).
| Group 1 | |
|---|---|
| Interviewed | 350 (40.9%) |
| Refusal | 34 (4%) |
| Inexistent or wrong number | 229 (26.8%) |
| No response | 112 (13.1%) |
| Other | 130 (15.2%) |
| Total (contacted) | 855 (100%) |
| Note: The sampling frame for the survey included 2,844 persons who had participated in the program. | |
The primary instrument of this study is a quantitative endline questionnaire. Participants answered a series of structured questions about their experience with the program and its impact on their labor market status after completion. The endline questionnaire was complemented with the socio-economic background data from the registration questionnaire. On average, the interviews were conducted 14 months after the participants registered for the measure.
The endline survey is used to estimate the association between active labor market measures and employment outcomes. The main outcome of interest is participants’ labor market status at the time of the survey. To contextualize program effects, we first examine participants’ satisfaction and perceptions of the program’s usefulness. We then provide descriptive statistics on labor market experience before and after program participation, as well as job characteristics of those employed.
To identify the characteristics of participants who benefited from the program, we employ regression analysis. Specifically, regression models are used to explore the relationship between being employed at the time of the survey and participants’ socio-economic background, alongside characteristics of the measures attended. This approach allows us to examine which factors are associated with a higher likelihood of being employed following program participation. The following linear probability model is estimated (Eq. 1):
where employedim is a binary indicator equal to one if individual i, who participated in the measure category m, is employed at the time of the survey. The vector Xim contains individual background characteristics such as gender, age, and education, and β is the corresponding parameter vector. The term γm denotes the measure fixed effects, capturing all unobserved characteristics that are common to the participants within the same measure category, while εim is the error term.
With this specification, the estimated coefficients β are interpreted as ceteris paribus associations based on within-measure variation. In other words, they reflect how individual characteristics are associated with employment outcomes when comparing participants who attended the same type of measure, holding constant both the observed individual covariates and all unobserved, time-invariant features of the measure itself. So, for instance, the coefficient of gender would give the association of gender and being employed for the same age, same level of education, same measure characteristics, etc.
4 Descriptive statistics
Table 2 presents the background characteristics of the 350 survey participants. The sample is almost evenly split by gender, with 52.9% women. Among the participants, 34.9% identified as returnees and 54.0% as Roma. The actual share of Roma is likely higher, as many choose not to self-declare as Roma due to stigma, multiple identities, or other reasons.
| Socio-demographic characteristics | |
|---|---|
| Female | 52.9% |
| Returnee | 34.9% |
| Roma | 54.0% |
| Age categories | |
| Up to 29 years | 40.1% |
| 30 to 49 years | 47.9% |
| 50 years or older | 12.0% |
| Educational level | |
| Incomplete primary school | 1.6% |
| Primary school | 38.2% |
| Secondary school (3 or 4 years) | 48.9% |
| Tertiary education | 11.4% |
| Employment | |
| Employed before program | 22.9% |
| Registered with the National Employment Service | 64.0% |
| N=350 | |
| Source: Registration questionnaire | |
In terms of age distribution, most participants were under 50: 40.1% were younger than 30, 47.9% were aged 30–49, and 12.0% were 50 or older. With respect to education, nearly half (48.9%) had completed secondary school, while 38.2% reported primary education only. A smaller share held tertiary qualifications (11.4%), and 1.6% did not complete primary school. Regarding the employment history, just 22.9% were employed prior to the program, while 64.0% were registered with the NES. These figures confirm that the program predominantly targeted unemployed individuals actively seeking work.
To better capture the labor market outcomes of the participants, we classify respondents into four groups according to the type of measure: (1) self-employment and start-up measures (e.g., business beginners’ courses, business planning and taxation, start-up training), (2) services (e.g., hairdressers, caretakers, caregivers), (3) industry (e.g., forklift operators, welders), and (4) other measures. This classification is applied consistently throughout the paper to analyze the specific outcomes that require further discussion. The participants are distributed approximately equally across the four groups.2
5 Results
5.1 Program satisfaction and usefulness
A large majority of the participants has been satisfied with the program, and found the program and certificate from the program useful for their future employment. Responses on satisfaction and self-reported impact of the program are shown in Table 3. A large share of the participants reported to be satisfied, since 92.1% of them gave a score of 6 or higher on the 1 to 10 points scale. They were similarly satisfied with the quality of theoretical and practical trainings (83.4% and 80.7% respectively).3 More than two thirds of the respondents said that the program was useful in their job search (71.9%). Four out of five participants received a certificate, and among those who received a certificate, 78.6% said that the certificate was useful for employment. Of all the participants, 63.3% responded that the skills acquired were useful for work. The participants of self-employment and start-up measures were the ones least likely to report that the skills were useful (54.2%). Conversely, among the participants in the measures for services sector, 70.3% reported that the skills were useful for the job.
| Total | Female | Male | Diff. | |
|---|---|---|---|---|
| N=350 | N=185 | N=165 | ||
| Satisfied with the program | 92.1% | 93.0% | 91.1% | not sign. |
| Satisfied with the quality of theoretical (classroom) learning | 83.4% | 87.4% | 78.9% | ** |
| Satisfied with the quality of practical learning | 80.7% | 83.0% | 78.2% | not sign. |
| The program useful in job search | 71.9% | 79.2% | 63.8% | *** |
| Received a certificate | 78.6% | 86.2% | 70.1% | *** |
| The certificate useful for employment | 73.0% | 75.8% | 68.9% | not sign. |
| The skills acquired useful for work | 63.3% | 70.0% | 55.7% | *** |
| Improved labor market status | *** | |||
| Better preparation for job search | 44.3% | 50.7% | 36.7% | |
| Finding an adequate job after finishing your program/measure | 9.6% | 9.5% | 9.9% | |
| Earning a higher salary than before the program/measure | 11.4% | 11.8% | 11.0% | |
| Getting a better job | 8.6% | 6.5% | 11.2% | |
| Labor market situation did not improve | 7.4% | 5.7% | 9.5% | |
| Other | 18.6% | 15.8% | 21.8% | |
| Improved aspects in current job due to participation...* | ||||
| Possibilities for applying the acquired competencies | 58.5% | 55.7% | 61.6% | not sign. |
| Job security | 33.8% | 32.2% | 35.5% | not sign. |
| Social status and recognition (no discrimination) | 20.5% | 17.0% | 24.4% | not sign |
| Satisfying salary | 26.1% | 23.7% | 28.6% | not sign |
| No effect on the suggested aspects | 36.0% | 40.8% | 30.8% | not sign. |
| Changes planned within the next three years* | ||||
| I have no major changes in mind | 32.8% | 32.9% | 32.6% | not sign. |
| To obtain higher income | 25.1% | 14.8% | 36.8% | *** |
| To start my own business | 20.8% | 22.7% | 18.7% | not sign. |
| To get employed | 31.9% | 33.3% | 30.4% | not sign. |
| Source: Authors | ||||
When asked about the ways the program helped them improve their labor market status, the respondents most frequently stated that it helped them be better prepared for the job search (44.3%), that it helped them earn a higher salary than before the program (11.4%) and that it helped them find an adequate job after the program (9.6%). While the responses suggest that some respondents benefited from the measures, the main improvement was that they were better prepared for job search.
Among the program participants, a certificate was received most frequently by those in industry and services (88.2% in both groups). However, the certificate (among those who received it) was more useful for the workers in services sector (81.5%) than for those in industry (67.2%). The workers in services sector were also most likely to find the skills acquired useful for work (70.2% vs. 64.4% in industry). Those involved in the self-employment and start-up measures were least likely to obtain the certificate (60.4%) and least likely to find it useful when receiving it (59.8%). This group was also least likely to find the skills acquired in the program useful for work (54.2%).
Employed persons were asked about the perceived benefits from the program attendance on their current job. They stated that they had the possibility of applying the acquired competencies (58.5%), that they had a satisfying salary (26.1%) and that their job gave them more job security (33.8%). Among the employed persons, approximately one out of three respondents stated that none of the suggested aspects improved in their current job, implying that they did not perceive any benefits from the program participation. We once again look through the lens of the four measure types (self-employment, services, industry and other) to understand whether there are differences between the four groups. The participant from the measures classified as self-employment and start-up (38.6%) and industry (42.6%) reported less frequently that there were no effects on the suggested aspects, whereas the participants in the services measures stated at the rate of 69.9% that no aspects improved. When asked about expected changes within next three years, the most frequent responses were that they planned to (1) get employed (32.8%), (2) earn a higher income (25.1%), (3) start their own business (20.8%) and (4) achieve more secure employment (14.5%). Every third respondent (32.2%) said that he/she did not have any major changes on their mind.
The data suggest that females were, overall, more satisfied with the measures. In particular, women were more likely to report that the program was useful in job search, receive a certificate, and consider the acquired skills useful for work. There were some minor differences with regards to planned changes within the next three years. Compared to men, women were less likely to report that they planned to get a higher salary within the next three years and to achieve more job security.
5.2 Employment
Table 4 presents the participants’ labor market status before the program and their subsequent experience after completing it. Prior to entering the program, 76.6% of the interviewed participants were unemployed. Among them, 20.1% were unemployed for less than one year, 14.6% between one and two years, and the majority (65.2%) for more than two years. This indicates that the measure was well targeted toward individuals actively seeking jobs, particularly the long-term unemployed.
| Total | Female | Male | Diff. | |
|---|---|---|---|---|
| N=350 | N=185 | N=165 | ||
| Labor market experience | ||||
| Before the program | ||||
| Unemployed before program | 76.6% | 79.5% | 72.3% | not sign. |
| Unemployment length before the program | not sign. | |||
| Unemployed for less than 1 year | 20.1% | 18.3% | 22.5% | |
| Unemployed between 1 and 2 years | 14.6% | 11.9% | 18.1% | |
| Unemployed for more than 2 years | 65.2% | 69.8% | 59.4% | |
| After the program | ||||
| Number of labor market transitions after the program | not sign. | |||
| 1 | 81.9% | 83.3% | 80.4% | |
| 2 | 11.9% | 10.9% | 13.0% | |
| 3 | 4.1% | 4.9% | 3.3% | |
| 4 | 2.1% | 0.9% | 3.3% | |
| Employed | 65.2% | 67.3% | 63.1% | not sign. |
| Current labor market status | not sign. | |||
| Employed full-time | 33.2% | 34.1% | 32.2% | |
| Employed part-time | 0.4% | 0.7% | 0.0% | |
| Self-employed/freelance work | 22.7% | 19.5% | 25.8% | |
| Occasional job | 6.4% | 5.1% | 7.6% | |
| Further vocational education/training | 2.7% | 3.6% | 1.7% | |
| Not employed, but searching for a job | 26.4% | 22.8% | 30.1% | |
| Inactive - Family issues (pregnancy, migration, illness, etc.) | 6.6% | 10.6% | 2.6% | |
| Inactive other reasons (housewife/husband, etc.) | 1.8% | 3.5% | 0.0% | |
| Length of employment (current months) | 16.2 | 16.5 | 15.8 | not sign. |
| Length of unemployment (current months) | 12.5 | 14.3 | 9.8 | ** |
| Length of inactivity (current in months) | 11.1 | 8.7 | 11.8 | not sign. |
| A p-value lower than 0.1 implies that the difference between the two groups is statistically significant at 10%. * significant at 1%, ** significant at 5%, *** significant at 10%. | ||||
At the time of the interview, approximately two-thirds of the respondents (65.2%) were employed, most of them in full-time jobs or self-employment, while only few held occasional jobs. By contrast, 26.4% reported actively searching for work, and 6.1% were inactive due to education, family responsibilities, or other reasons. Given that only 23.4% were employed before entering the program, these results suggest an increase of about 38.8 percentage points in employment after the program participation. It is important to note, however, that this reflects the gross effect of the program, as no comparison group is available.
Those who were employed reported having worked, on average, for 16.2 months prior to the interview. Unemployed participants were in that status for 12.5 months on average, while the inactive reported 11.1 months. The respondents were also asked about their labor market trajectories following the completion of the GIZ program. Overall, relatively few job transitions were reported. Since transitions were only recorded for the post-program period, we observe that 81.9% of the participants continued in the same activity4 as immediately after the program, indicating no transitions. Another 11.9% reported one transition (two activities), 4.1% reported two transitions (three activities), and 2.1% reported three transitions (four activities). These findings suggest relatively stable labor market status: the participants tended to remain either employed or unemployed/inactive for a considerable period. This runs counter to the expectation that they would change their status more frequently.
There are no differences in the labor market experience of females and males.
Table 5 summarizes participants’ training experiences and employment outcomes across different sectors. The lowest employment rate was observed in the services sector, where 53.8% of the participants were employed at the time of the interview. This sector also recorded the smallest gross effect of all groups—an increase of 27.4 percentage points (from 26.4% before to 53.8% after the program). By contrast, employment outcomes in the other three categories - self-employment, industry, and other sectors were more favorable, with about 69% of the participants being employed at the time of the interview. The lowest pre-program employment share was recorded in the industry group (21.6%), which resulted in the largest gross employment effect of 48.2 percentage points. In other sectors, the gross effect was 46.4 percentage points (from 22.4% before to 68.8% after), while among the self-employed it amounted to 33.5 percentage points (from 34.4% to 67.9%).
| Self-employment | Services | Industry | Other | Total | |
|---|---|---|---|---|---|
| N=79 | N=85 | N=83 | N=103 | N=350 | |
| Training useful for job search | 64.3% | 73.3% | 70.6% | 77.6% | 71.9% |
| Received certificate | 60.5% | 87.5% | 88.2% | 69.8% | 78.6% |
| Certificate useful | 59.8% | 81.5% | 67.2% | 78.7% | 73.0% |
| Skills acquired useful for work yes | 54.2% | 70.3% | 64.4% | 63.2% | 63.3% |
| Employed before training | 34.4% | 26.4% | 21.6% | 22.4% | 25.8% |
| Employed currently | 67.9% | 53.8% | 69.8% | 68.8% | 65.2% |
| Increase in employment in p.p. | 33.5 p.p. | 27.4 p.p. | 48.2 p.p. | 46.4 p.p. | 39.4 p.p. |
| No written agreement (if employed) | n/a | 41.4% | 7.2% | 4.7% | 11.6% |
These results should be interpreted in conjunction with the participants’ assessments of the program’s usefulness. The service sector participants were most likely to report that the certificates and skills acquired were valuable, yet they also experienced the weakest employment gains. This may indicate that, despite improved skills, they still faced the greatest challenges in finding work. Conversely, the more modest improvements among the self-employed correspond with their relatively lower ratings of program usefulness.
Therefore, the gross improvement in employment was the highest in the industry sector. On the other hand, while the employment increased the least for the service sector workers, they found that this program significantly improved their chances of obtaining work in the labor market. For the self-employed, both increase in employment and opinion on the program were less favorable compared to the average values.
Turning now to the job characteristics of the employed persons (Table 6), it can be observed that, among the employed, a considerable share is self-employed (34.7%), while 52.0% are employed with a written contract and only a small share has only an oral contract (6.8%). Among the respondents, most had longer term contracts. 37.8% had a contract lasting 7-12 months, while another 18.3% had permanent contracts. This question was not applicable to the self-employed. Due to the low percentage of participants who have permanent contracts, we may conclude that the job security among the participants is low. The large group of self-employed in the sample does not have any job security. Most participants earn between 30,001 RSD (256 Euros) and 60,000 RSD (512 Euros), in particular, between 30.001 (256 Euros) and 40.000 RSD (341 Euros): 25.4%; between 40.001 (341 Euros) and 60.000 RSD (512 Euros): 40.9%). The median wage in Serbia in April 2022 stood at 55,267 RSD (471 Euros) and the mean was 73,012 RSD (622 Euros). It can be observed that the respondents rarely reported an income above the mean. Among the participants who are employed with a company, over 90% has the standard benefits such as annual paid leave, paid sick leave, pension benefits, medical insurance and social security contributions. There are significant differences in terms of wages between men and women, where the men reported higher earnings than the women. No other significant differences by gender are observed.
| Total | Female | Male | ||
|---|---|---|---|---|
| N=214 | N=106 | N=108 | ||
| Panel B: Job characteristics of the employed (current) | ||||
| Contract type | not sign. | |||
| A written agreement (unlimited duration) | 18.0% | 14.1% | 21.4% | |
| A written agreement (limited duration) | 34.0% | 40.9% | 28.0% | |
| An oral agreement | 6.8% | 10.2% | 3.9% | |
| Not applicable (self-employed, etc.) | 41.2% | 34.8% | 46.8% | |
| Contract duration | not sign. | |||
| Less than 3 months | 5.5% | 3.9% | 7.0% | |
| From 7 to 12 months | 37.8% | 47.1% | 29.6% | |
| More than 12 months | 1.7% | 1.2% | 2.2% | |
| Permanent | 18.3% | 14.2% | 21.9% | |
| Not applicable (self-employed, etc.) | 36.6% | 39.3% | 33.6% | |
| Wage categories | *** | |||
| Less than 20.000 RSD | 8.1% | 6.1% | 10.2% | |
| Between 20.001 and 30.000 RSD | 8.0% | 11.6% | 4.3% | |
| Between 30.001 and 40.000 RSD | 25.4% | 34.8% | 15.9% | |
| Between 40.001 and 60.000 RSD | 40.9% | 44.2% | 37.6% | |
| Between 60.001 and 80.000 RSD | 9.7% | 3.2% | 16.3% | |
| More than 80.001 RSD | 7.8% | 0.0% | 15.7% | |
| Benefits in current job+ | 100.0% | 100.0% | 100.0% | |
| Annual paid leave (holiday time) | 93.8% | 96.0% | 91.4% | not sign. |
| Paid sick leave | 92.3% | 94.7% | 89.7% | not sign. |
| Pension/old age insurance | 93.6% | 95.3% | 91.6% | |
| Medical insurance coverage | 97.3% | 98.2% | 96.2% | not sign. |
| Social security contribution | 95.6% | 97.1% | 93.9% | not sign. |
By the type of program, the lowest job security was observed among the respondents who participated in the service sector program. Among the wage-employed respondents, about 40% reported working under oral contracts; in industry and other sectors the corresponding shares were approximately 7% and 5%, respectively.
5.2.1 What are the characteristics of the participants who found employment?
In Table 7 we compare the labor market status before and after the program. Three out of four participants who were employed before the program remained employed. Before the program, 76.7% of the participants were unemployed, among these 47.5% went from unemployment to employment, 21.9% remained unemployed and 7.2% went from unemployment into inactivity.
| After the program - at survey (N=350) | ||||
|---|---|---|---|---|
| Before the program | Employed | Unemployed | Inactive | Total |
| Employed | 17.6% | 5.1% | 0.7% | 23.4% |
| Unemployed | 47.5% | 21.9% | 7.2% | 76.6% |
| Total | 65.1% | 27.0% | 7.9% | 100% |
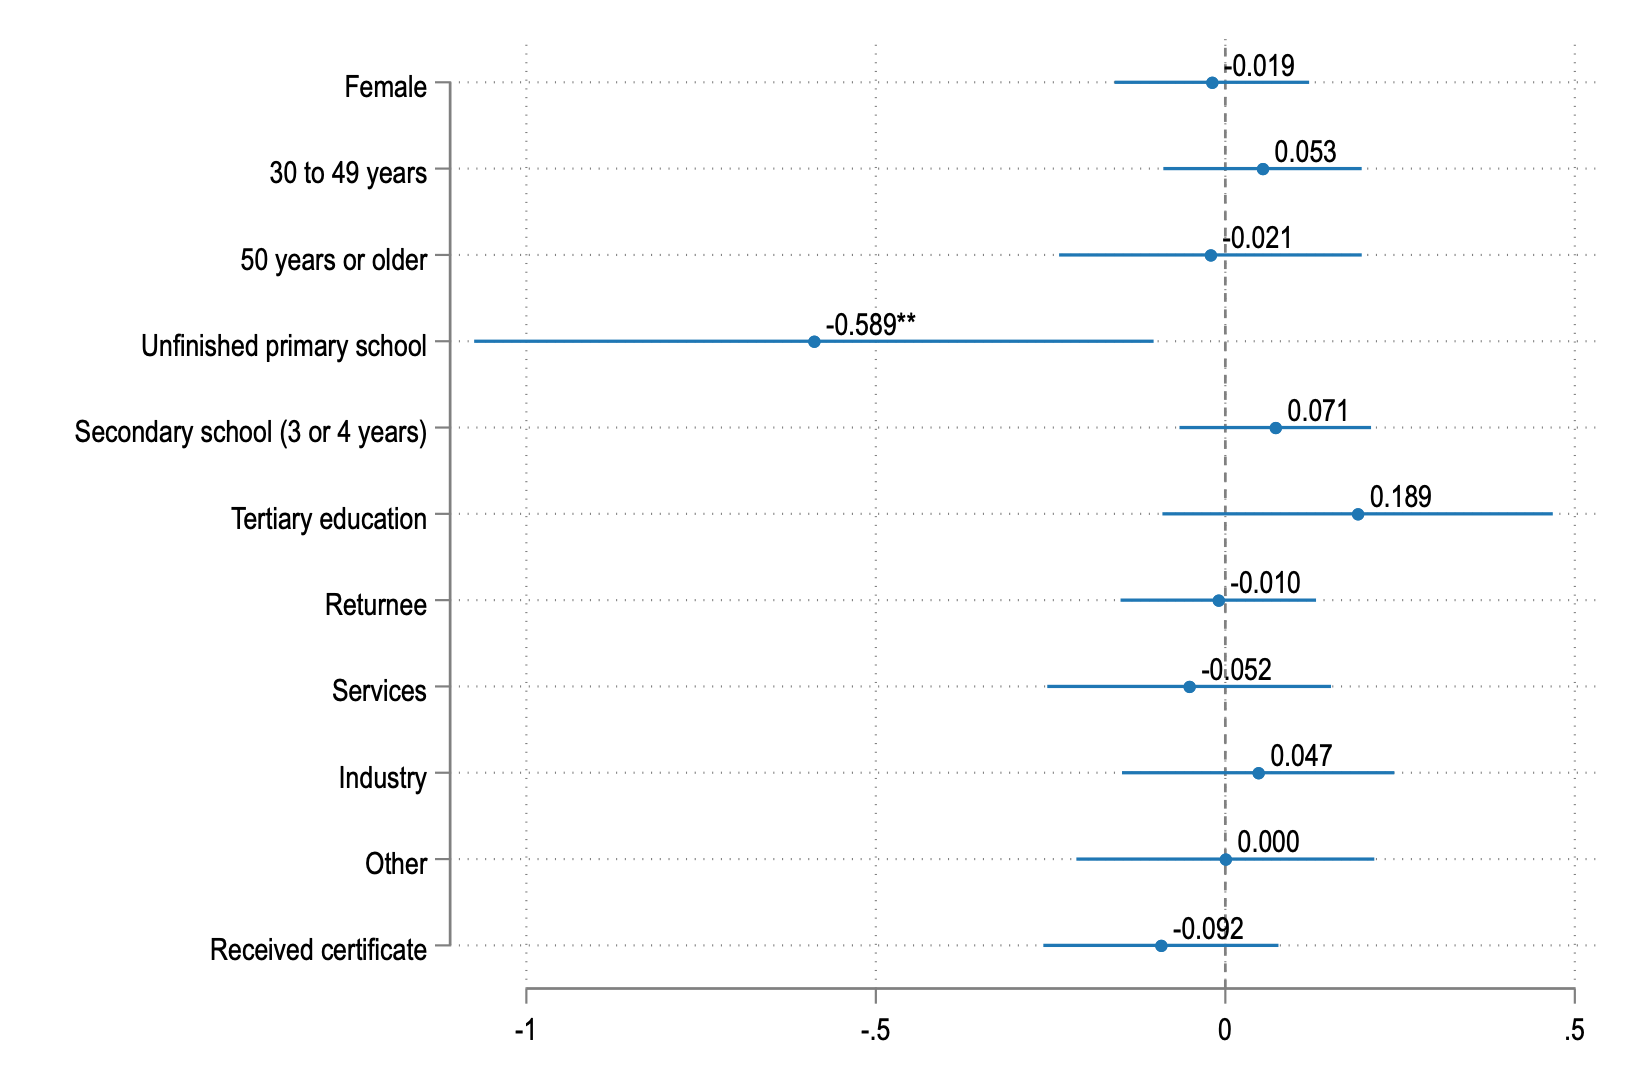
We now turn to regression analysis to understand whether any individual characteristic is associated with a higher employment probability. We consider two sets of characteristics. First, we consider individual background characteristics such as gender, age, educational background and returnee status. The second set of characteristics are those related to the measure, in particular: the type of measure (self-employment/start-up, services, industry and other) and whether the person received a certificate. Our findings are shown in Figure 1 and the only characteristic that makes a difference in terms of finding employment is the educational background. While statistically not-significant, there is some evidence that the individuals who were more educated, i.e. secondary or tertiary education, had a higher probability to be employed. Persons with unfinished primary school had lower chances of having employment, but there were very few of them in the sample (5 participants). The regression estimates should be interpreted in the following way. Holding all other variables constant (i.e. gender, returnee status, type of measures, certificate), a person with tertiary education was 18.9 percentage points more likely to be employed than a person with completed primary education (baseline category). While descriptive statistics suggest some differences in employment outcomes between measure types, these differences do not remain statistically significant once individual characteristics and measure fixed effects are controlled for. Women and returnees had the same chances to be employed as their respective counterparts.
Figure 1. Regression coefficients for outcome employed
Notes: Baseline for age is group 29 or younger. Baseline for education is finished primary school. Baseline for measure category is self-employment. * significant at 1%, ** significant at 5%, *** significant at 10%.
6 Discussion and conclusion
The program comprised four interventions - self-employment/start-up, industry, services, and other measures, with impacts varying by category, consistent with sector-specific effects documented in prior studies (Crépon & van den Berg, 2016; Dvouletý & Lukeš, 2016). Overall, a majority of respondents considered the acquired skills useful. Among those employed at follow-up, outcomes were more favorable for the participants in self-employment and industry than for those in service-sector support, nearly 70% of whom reported no concrete on-the-job benefits, suggesting lower wage potential, or a training–market mismatch, in line with Escudero (2018).
Overall employment increased substantially following the participation, confirming the strong gross improvements documented in the Results section. Consistent with the descriptive evidence, employment gains were strongest in industry and weakest in services. Despite weaker employment effects, service participants reported slightly higher satisfaction with the training and credentials. Education strongly shaped transitions: higher educational attainment increased the likelihood of employment, supporting the existing evidence that ALMPs are more effective with better-educated participants (Plavgo, 2023). More broadly, this study follows a common approach in the ALMPs evaluation literature based on observational data and correlational analysis, which emphasizes descriptive patterns and heterogeneity rather than causal identification
Job quality improvements were limited, with relatively low levels of employment stability. Very few respondents credited the program with higher earnings, consistent with the findings that training effects on wages often fade (Borra et al., 2012). While incentives can reactivate the long-term unemployed (European Training Foundation, 2025), effects here were modest on contract quality and pay. Confidence in future prospects remained limited: 32.2% expected no major change over the next three years.
Overall, the satisfaction with the program and its labor market effects was high, particularly among women. Yet the concrete outcomes in terms of income and job security were more limited. The heterogeneity of the results across interventions highlights the importance of aligning program content more closely with sector-specific labor market needs.
It should be noted that the analysis is based on a single endline survey of program participants and does not include a control or comparison group. The interpretation of the obtained findings should take into account potential biases mainly referring to social desirability and non-responsiveness. These limitations prevent the establishment of causal relationships between the intervention and the observed results, while the findings should be interpreted as descriptive and associative rather than causal.
The research findings suggest several policy recommendations for the design and implementation of similar programs in the future. First, intervention should be grounded in systematic, pre-implementation skills assessments. This would help ensure that employed participants receive support tailored to their current job requirements, while unemployed individuals developing skills aligned with actual labor market needs. Second, program effectiveness could be enhanced by integrating demand-side policies, thereby increasing the likelihood of successful labor market integration. Third, given the high vulnerability of the target population and the significant share of the participants with limited expectations for future improvements, systematic outcome monitoring is essential. Regular tracking of employment status, income, and job quality combined with follow-up support would strengthen the sustainability and impact of program results.
Finally, given that effects of the program were correlated with the educational background rather than the socio-economic backgrounds (gender or returnee status) of the participants, or the program design specifics (specific measure provided or certificate), future measures should be designed to address deficits in formal education. Incorporating investments in general skills development could improve long-term employability and resilience.
Preparation of this research paper was funded by the Ministry of Science, Technological Development and Innovation of the Republic of Serbia under contract number 451-03-136/2025-03. The research presented in this paper was financially supported by the Deutsche Gesellschaft für Internationale Zusammenarbeit (GIZ) GmbH under the project Inklusion von Roma und anderen marginalisierten Gruppen in Serbien, Contract No: 83401461.
Data availability statement
Data are available from the authors upon request.
Coauthor contributions
Lara Lebedinski: Conceptualization, Data curation, Investigation, Methodology, Writing - Original Draft, Writing - Review & Editing
Mihajlo Đukić: Investigation, Writing - Original Draft, Writing - Review & Editing, Validation
Dejana Pavlović: Investigation, Writing - Original Draft, Writing - Review & Editing, Validation
References
- Borra, C., Palma, L., González, M. C., & Aguado, L. F. (2012). Evaluation of an active labor market program in a context of high unemployment. Desarrollo Y Sociedad, 70, 93-115.
- Cace, S., & Ionescu, M. (2006). Employment policy for Roma. Editor Expert.
- Cahn, C., & Guild, E. (2010). Recent Migration of Roma in Europe. Organization for Security and Co-operation in Europe High Commissioner on National Minorities; Council of Europe Commissioner for Human Rights. https://www.osce.org/sites/default/files/f/documents/4/d/78034.pdf
- Crépon, B., & van den Berg, G. J. (2016). Active labor market policies. Annual Review of Economics, 8(1), 521-546. https://doi.org/10.1146/annurev-economics-080614-115738
- Dincă, M., & Lucheș, D. (2018). Work integration of the Roma: Between family and labor market. Sustainability, 10(5), 1495. https://doi.org/10.3390/su10051495
- Dvouletý, O., & Lukeš, M. (2016). Review of empirical studies on self-employment out of unemployment: Do self-employment policies make a positive impact?. International Review of Entrepreneurship, 14(3), 361-376.
- Escudero, V. (2018). Are active labor market policies effective in activating and integrating low-skilled individuals? An international comparison. IZA Journal of Labor Policy, 7(1), 4. https://doi.org/10.1186/s40173-018-0097-5
- European Commission. (2020). Communication from the Commission to the European Parliament and the Council: A Union of Equality: EU Roma strategic framework for equality, inclusion and participation. https://eur-lex.europa.eu/legal-content/EN/TXT/?uri=CELEX:52020DC0620
- European Training Foundation. (2025). Evaluating active labor market policies in fragile contexts: Insights and lessons from evaluation studies in the ETF partner countries. https://www.etf.europa.eu/sites/default/files/2025-04/ALMPs%20EFFECTIVENESS%20REPORT_FRAGILE_CONTEXTS_for_publication.pdf
- European Union Agency for Fundamental Rights. (2016). Second European Union Minorities and Discrimination Survey: Roma – Selected findings. Publications Office of the European Union. https://fra.europa.eu/sites/default/files/fra_uploads/fra-2016-eu-minorities-survey-roma-selected-findings_en.pdf
- European Union Agency for Fundamental Rights. (2022). Roma in 10 European countries – Main results: Roma survey 2021. Publications Office of the European Union. https://fra.europa.eu/sites/default/files/fra_uploads/fra-2022-roma-survey-2021-main-results2_en.pdf
- Hyde, A. (2006). Systemic exclusion of Roma from employment. https://www.errc.org/roma-rights-journal/systemic-exclusion-of-roma-from-employment
- Kahanec, M., & Zimmermann, K. F. (2010). High-skilled immigration policy in Europe. IZA. https://www.iza.org/publications/dp/5399/high-skilled-immigration-policy-in-europe
- Lebedinski, L. (2019). The effect of residential segregation on formal and informal employment of Roma in Serbia. Eastern European Economics, 58(2), 108-136. https://doi.org/10.1080/00128775.2019.1689143
- Lebedinski, L., Đukić, M., & Pavlović, D. (2025). An assessment of the socio-economic impact of water access for Roma and other marginalized groups in rural Serbia. Economics of Agriculture, 72(1), 123-138. https://doi.org/10.59267/ekoPolj2501123L
- O’Higgins, N. (2012). Roma and non-Roma in the labour market in Central and South Eastern Europe. IZA. https://www.aiel.it/page/old_paper/OHiggins1.pdf
- Plavgo, I. (2023). Education and active labor market policy complementarities in promoting employment: Reinforcement, substitution and compensation. Social Policy & Administration, 57(2), 235-253. https://doi.org/10.1111/spol.12894
- Preoteasa, A. M. D. (2013). Roma women and precarious work: Evidence from Romania, Bulgaria, Italy and Spain. Revista De Cercetare Si Interventie Sociala, 43, 155-168. https://www.researchgate.net/publication/289352580_Roma_Women_and_Precarious_Work_Evidence_from_Romania_Bulgaria_Italy_and_Spain
- Rostas, I. (2019). A task for Sisyphus: Why Europe’s Roma policies fail. Central European University Press. https://library.oapen.org/viewer/web/viewer.html?file=/bitstream/handle/20.500.12657/45635/9789633863206.pdf?sequence=1&isAllowed=y
- Simeunovic Bajic, N. (2011). Roma in Serbia after the collapse of Yugoslavia: Political implications and media silence on racial violence. European Journal of Interdisciplinary Studies, 3(2), 87-93. https://ejist.ro/files/pdf/344.pdf
- Stankovic, A. (2022). Analiza o zaposlenosti Roma i Romkinja na tržištu rada u Srbiji i zemljama Zapadnog Balkana. Fondacija za obrazovanje Roma. https://romi-obrazovanjem-do-posla.org.rs/wp-content/uploads/2023/02/Analiza-o-zaposlenosti-Roma-i-Romkinja.pdf
- Strategy for Social Inclusion of Roma 2016–2025 (2016). Official Gazette of the Republic of Serbia, No. 26/16. https://pravno-informacioni-sistem.rs/eli/rep/sgrs/vlada/strategija/2016/26/1/reg
- Ullah, A. K. M. A., Azizuddin, M., & Ferdous, J. (2024). The Roma population: Migration, settlement, and resilience. Social Sciences, 13(9), 476. https://doi.org/10.3390/socsci13090476
- United Nations Development Programme. (2015). Decade of Roma Inclusion: Progress report. https://files.acquia.undp.org/public/migration/eurasia/DORI-REPORT.pdf
- United Nations Development Programme. (2018). Regional Roma Survey 2017: Country fact sheets. https://www.undp.org/eurasia/publications/regional-roma-survey-2017-country-fact-sheets
- Vidojević, J., & Perišić, N. (2015). The power of discourse: Reflections on the obstacles to social inclusion of Roma in Serbia. Social Inclusion, 3(5), 137-147. https://doi.org/10.17645/si.v3i5.235
Footnotes
- Serbian citizens of Roma ethnicity who have been returned to Serbia under readmission procedures from EU (or other) states after no longer meeting the legal conditions for entry, presence, or residence abroad (e.g., following a rejected asylum claim or irregular stay).
- Self-employment: 79, services: 85, industry: 83, other: 103.
- The question on satisfaction as well as other questions with 1 to 10-point Likert scale were coded in the following way. Answers 1 to 5 are considered negative whereas 6 to 10 are positive.
- The questionnaire includes the following activities: 1) Employed full-time, 2) Employed part-time, 3) Self-employed/freelance work, 4) Occasional job, 5) Internship, 6) Further vocational education/training, 7) Housewife, househusband, family work, 8) Not employed, but searching for a job, 9) Inactive - Family issues (pregnancy, migration, illness, etc.), 10) Inactive (other reasons).
Article Details
Published by the Institute of Social Sciences - Center for Demographic Research


References
Cace, S., & Ionescu, M. (2006). Employment policy for Roma. Editor Expert.
Cahn, C., & Guild, E. (2010). Recent Migration of Roma in Europe. Organization for Security and Co-operation in Europe High Commissioner on National Minorities; Council of Europe Commissioner for Human Rights. https://www.osce.org/sites/default/files/f/documents/4/d/78034.pdf
Crépon, B., & van den Berg, G. J. (2016). Active labor market policies. Annual Review of Economics, 8(1), 521-546. https://doi.org/10.1146/annurev-economics-080614-115738
Dincă, M., & Lucheș, D. (2018). Work integration of the Roma: Between family and labor market. Sustainability, 10(5). https://doi.org/10.3390/su10051495
Dvouletý, O., & Lukeš, M. (2016). Review of empirical studies on self-employment out of unemployment: Do self-employment policies make a positive impact?. International Review of Entrepreneurship, 14(3), 361-376.
Escudero, V. (2018). Are active labor market policies effective in activating and integrating low-skilled individuals? An international comparison. IZA Journal of Labor Policy, 7(1). https://doi.org/10.1186/s40173-018-0097-5
European Commission. (2020). Communication from the Commission to the European Parliament and the Council: A Union of Equality: EU Roma strategic framework for equality, inclusion and participation. https://eur-lex.europa.eu/legal-content/EN/TXT/?uri=CELEX:52020DC0620
European Training Foundation. (2025). Evaluating active labor market policies in fragile contexts: Insights and lessons from evaluation studies in the ETF partner countries. https://www.etf.europa.eu/sites/default/files/2025-04/ALMPs%20EFFECTIVENESS%20REPORT_FRAGILE_CONTEXTS_for_publication.pdf
European Union Agency for Fundamental Rights. (2016). Second European Union Minorities and Discrimination Survey: Roma – Selected findings. Publications Office of the European Union. https://fra.europa.eu/sites/default/files/fra_uploads/fra-2016-eu-minorities-survey-roma-selected-findings_en.pdf
European Union Agency for Fundamental Rights. (2022). Roma in 10 European countries – Main results: Roma survey 2021. Publications Office of the European Union. https://fra.europa.eu/sites/default/files/fra_uploads/fra-2022-roma-survey-2021-main-results2_en.pdf
Hyde, A. (2006). Systemic exclusion of Roma from employment. https://www.errc.org/roma-rights-journal/systemic-exclusion-of-roma-from-employment
Kahanec, M., & Zimmermann, K. F. (2010). High-skilled immigration policy in Europe. IZA. https://www.iza.org/publications/dp/5399/high-skilled-immigration-policy-in-europe
Lebedinski, L. (2019). The effect of residential segregation on formal and informal employment of Roma in Serbia. Eastern European Economics, 58(2), 108-136. https://doi.org/10.1080/00128775.2019.1689143
Lebedinski, L., Đukić, M., & Pavlović, D. (2025). An assessment of the socio-economic impact of water access for Roma and other marginalized groups in rural Serbia. Economics of Agriculture, 72(1), 123-138. https://doi.org/10.59267/ekoPolj2501123L
O’Higgins, N. (2012). Roma and non-Roma in the labour market in Central and South Eastern Europe. IZA. https://www.aiel.it/page/old_paper/OHiggins1.pdf
Plavgo, I. (2023). Education and active labor market policy complementarities in promoting employment: Reinforcement, substitution and compensation. Social Policy & Administration, 57(2), 235-253. https://doi.org/10.1111/spol.12894
Preoteasa, A. M. D. (2013). Roma women and precarious work: Evidence from Romania, Bulgaria, Italy and Spain. Revista De Cercetare Si Interventie Sociala, 43, 155-168. https://www.researchgate.net/publication/289352580_Roma_Women_and_Precarious_Work_Evidence_from_Romania_Bulgaria_Italy_and_Spain
Rostas, I. (2019). A task for Sisyphus: Why Europe’s Roma policies fail. Central European University Press.
Simeunovic Bajic, N. (2011). Roma in Serbia after the collapse of Yugoslavia: Political implications and media silence on racial violence. European Journal of Interdisciplinary Studies, 3(2), 87-93. https://ejist.ro/files/pdf/344.pdf
Stankovic, A. (2022). Analiza o zaposlenosti Roma i Romkinja na tržištu rada u Srbiji i zemljama Zapadnog Balkana. Fondacija za obrazovanje Roma. https://romi-obrazovanjem-do-posla.org.rs/wp-content/uploads/2023/02/Analiza-o-zaposlenosti-Roma-i-Romkinja.pdf
Strategy for Social Inclusion of Roma 2016–2025 (2016). Official Gazette of the Republic of Serbia, No. 26/16. https://pravno-informacioni-sistem.rs/eli/rep/sgrs/vlada/strategija/2016/26/1/reg
Ullah, A. K. M. A., Azizuddin, M., & Ferdous, J. (2024). The Roma population: Migration, settlement, and resilience. Social Sciences, 13(9). https://doi.org/10.3390/socsci13090476
United Nations Development Programme. (2015). Decade of Roma Inclusion: Progress report. https://files.acquia.undp.org/public/migration/eurasia/DORI-REPORT.pdf
United Nations Development Programme. (2018). Regional Roma Survey 2017: Country fact sheets. https://www.undp.org/eurasia/publications/regional-roma-survey-2017-country-fact-sheets
Vidojević, J., & Perišić, N. (2015). The power of discourse: Reflections on the obstacles to social inclusion of Roma in Serbia. Social Inclusion, 3(5), 137-147. https://doi.org/10.17645/si.v3i5.235