
Intra-settlement Redistribution of Daytime and Nighttime Population
Article Sidebar
Main Article Content
Abstract
This study analyses the spatial–temporal differences between daytime and nighttime populations in Serbia’s largest urban centres—Belgrade, Novi Sad, and Niš—using data from the 2022 Population Census and 2018 Urban Atlas land-use classifications. The Diurnal Population Change Index (Idpc) was applied to identify areas with predominantly work-oriented or residential functions. Results show that Belgrade attracts nearly 147,000 inbound commuters daily, accounting for 18.5% of all commuting workers in Serbia, while Novi Sad and Niš exert strong but regionally confined influences. The greatest differences between day and night population densities occur in continuous urban fabric and industrial–commercial zones, highlighting the dominant role of central business areas. Integration of census, functional, and geospatial data allowed for a more precise interpretation of functional structures and commuting patterns. The study also demonstrated the analytical potential of combining Urban Atlas classifications with 3D visualisation for identifying daytime “hotspots” and communicating urban dynamics. The findings underline the importance of incorporating temporary population models into urban planning, transport management, and emergency preparedness, and provide a methodological basis for further research on temporary populations and commuting in the context of spatial and functional urban analysis.
1 INTRODUCTION
In recent decades, the phenomenon of daily population mobility has gained increasing attention in demographic and spatial studies, especially through the concept of temporary population (Charles-Edwards 2016;Brollo and Celata 2022). This concept encompasses individuals who are present in a given area during the day but reside elsewhere during the night, a dynamic that profoundly affects urban structure, infrastructure load, and service provision (Mileu and Queirós 2022). The most significant and quantifiable component of the temporary population is the group of commuters—individuals who travel daily for work from their place of residence to a different location (Lukić 2011a;Tošić 2018).
Most population data are derived from censuses, which offer only statical snapshots and fail to reflect short-term spatiotemporal dynamics, especially those caused by commuting flows (Panczak, Charles-Edwards and Corcoran 2020). Consequently, there is a growing need to bridge this gap through the integration of demographic data with geospatial datasets and functional land use models (Qi et al. 2015).
In the context of Serbia, the spatial and functional restructuring of settlements over recent decades has been strongly influenced by commuting patterns (Lukić 2011b). Rapid urbanization, regional disparities in employment opportunities, and limited access to affordable housing in central urban areas have fostered complex daily mobility systems (Filipović, Krunić and Zhelenkova 2022), especially around major employment hubs such as Belgrade, Novi Sad, and Niš (Miletić 2022;Kokotović Kanazir, Panić and Drobnjaković 2024). These systems generate significant differences between daytime and nighttime population levels, with implications for urban planning, transport policy, and emergency response capacity (Krunić 2012).
This study aims to analyse the extent and spatial patterns of daily population change in selected urban settlements in Serbia, with particular focus on intra-settlement redistribution driven by commuting. The study area comprises the three most important urban centers in the territory of Serbia: Belgrade, Novi Sad, and Niš, each representing a distinct region. In addition to their demographic and territorial dominance within Serbia’s geosystem, it is essential to emphasize their functional significance, as their influence extends beyond the boundaries of their administrative areas (Tomašević and Sokolovska 2017;Živanović et al. 2019;Filipović, 2020;Živanović et al. 2021). Using data from the 2022 Population Census (additionally processed data on commuting) and the Urban Atlas, the research combines demographic statistics with land use classification to model spatiotemporal population distributions and identify zones of dominant employment and residential functions. An important focus is placed on quantifying the diurnal 1 population change index as a tool for distinguishing between employment centres and “bedroom communities” (Jolley, Lane and Brun 2011).
The primary objective of this study is to conduct a preliminary investigation into the potential application of the Urban Atlas (UA) and origin–destination data on commuting, with the aim to enhance the understanding of daily human mobility patterns and shifts in population density. The research findings are expected to contribute to advancing further studies on the interrelationship between land-use dynamics and population distribution within urban areas, thereby supporting the development of more effective models and tools for urban planning of commercial, residential, and mixed-use zones, as well as for intra- and inter-urban transportation systems. Moreover, the results may prove valuable for specialized research efforts in the fields of urban sustainability, emergency management and prevention, infrastructure load modelling, environmental impact assessment, and related domains.
The subsequent section presents the theoretical framework, i.e., a review of the most relevant literature for the research. This is followed by a delineation of the spatial framework and description of the methodology employed in calculating the temporary population, as well as the measurement of differences and change indices between nighttime and daytime populations, together with the procedure for determining the intra-settlement distribution of population by land-use categories. The results section provides an overview of the analysed indicators at the national level, followed by a detailed examination of Belgrade, Novi Sad, and Niš. For each settlement and its constituent parts, the analysis includes the spatiotemporal distribution of population based on absolute and index measures, as well as land-use classifications, with both standard and 3D visualizations. The discussion compares and interprets the findings, offering critical remarks and proposals for further research. The paper concludes with a synthesis of the final considerations.
2 THEORETICAL BACKGROUND
When defining variations and modalities of spatiotemporal manifestations of functional-urban and metropolitan regions and regional systems, the importance of commuting is particularly emphasised (Tošić 2018). Daily labour mobility is one of the fundamental elements used to determine the immediate functional area of a city (Duarte and Fernández 2017). Commuting depends mainly on the development of employment capacity and conditions in the city, the volume and structure of the available labour force in the surrounding areas and the development of transportation between the city and its surroundings. This type of relationship is significant for studying demographic, social, economic and other factors (Choorat et al. 2025). Daily mobility can be utilised to alleviate the pressure and mitigate housing, communal, educational and other problems in urban settlements (Ilić 1970). The process of commuting, especially of the economically active population, considering its strong connection to demographic development, economic development, transportation, settlements, as well as labour market and real estate market development, has broad implications in all spheres of life and work, both for residential and employment settlements (Lukić 2011a).
Disproportions in the spatial-demographic structure of Serbia, as a consequence of the spatial development model and transformations within the settlement network over the past decades, are manifested in the concentration of population within a limited geographical area, i.e., large urban centres (Vojković, Živanović and Magdalenić 2018). Serbia’s current urban system is marked by asymmetry and incoherence, and is dominated by the capital of Belgrade, indicating that the urbanization process has not been controlled (Živanović et al. 2019;Miljanović, Vuksanović-Macura and Doljak 2023). The factors that initiate the development of daily mobility in our region are primarily of socio-economic nature. In Serbia, the commuting process has gained significant proportions with the onset of industrialisation and agrarian depopulation (Matijević 2009). In more recent periods, external spatial and economic factors have a predominant influence on the direction, volume and the structure of daily mobility. They reflect the uneven economic development of territorial units at different levels and the concentration of functions in specific centres or cities. The most common reason for deciding to engage in commuting in Serbia are difficulties in resolving housing status in the employment settlements due to high housing prices and property costs in areas with a higher number of functions (Lukić 2011a). The structure of commuting flows by economic sectors reflects the existing quantitative and qualitative mismatch of the economically active population and the local needs of business subjects (Lukić 2022). In addition, the intensity and direction of commuting for fulfilling various socio-geographic functions are determined by the consistency and development of the distribution of public-social services and their users (Tošić 2018).
The latest research on commuting in the region mainly analyses the impact of the Covid-19 pandemic, as well as the post-Covid period. Studies from Greece, particularly in Thessaloniki and Athens, document short-term shifts in travel preferences during the pandemic, with increases in walking and cycling, and a partial return to car use after restrictions were lifted. More recent research for Athens offers evidence-based proposals on how to sustain these “active” modes of travel in the long run (Politis et al. 2021;Mexis, Tsigdinos and Spyropoulou 2025). Analyses from Belgrade covering 2020–2021 confirm strong pandemic impacts on mobility habits, describing a “modal shock,” changes in trip frequency and purpose, and providing guidance on how transport planning can adapt to crisis conditions (Simić et al. 2022;Glavić et al. 2023). In Bosnia and Herzegovina, a survey showed significant shifts in mode preferences during and after the pandemic, including reduced trust in public transport safety and a greater inclination toward private cars and walking (Čaušević 2023). Complementing these perspectives, a study of labour commuters in the north-western Romania explains the patterns at the micro level, including the role of industrial clusters, strategic commuting routes, and worker motivations—serving as a useful counterpoint to top-down statistics (Ferent 2023).
Recognising the significance of temporary population has grown in the majority of the world in recent decades, although a standardised methodology for their estimation still needs to be established (Charles-Edwards 2016). Temporary population refers to individuals who reside in a specific place for a limited time, without changing their place of residence (ONS 2023). Temporary population has been studied within Chinese cities, where rural migrants constitute a significant portion of the temporary population (Shen 2002;Qi et al. 2015). Additionally, similar studies have been conducted in the territory of South Korea (Jo, Lee and Kim 2020), Australia (Charles-Edwards et al. 2020), United States of America (Bian and Wilmot 2015) etc. The phenomenon of temporariness has also been analysed in the German context, particularly within the frameworks of multi-local living (Willecke 2025). In a study conducted in Italy, temporary populations, including non-resident tourists and students, were quoted as the main drivers of socio-spatial polarisation in cities and significant sources of both hard and soft urban changes (Brollo and Cellata 2022). A framework for official temporary population statistics has been proposed, which includes a conceptual framework connecting temporary population mobility and temporary population (Charles-Edwards et al. 2020). The majority of the analysed studies suggests that temporary populations are an important aspect of urban life and require attention from both researchers and decision-makers.
The models distinguishing between daytime and nighttime populations have wide applications in urban planning, service provision, and risk management (Kobayashi, Medina and Cova 2011). Traditional census data mainly represent the nighttime (resident) population, which often fails to reflect spatial shifts during the day when people commute for work, study, or leisure (Mileu and Queirós 2022;Wang et al. 2022;Guest 1976;ISTAT 2020). This mismatch can result in misestimating exposure, demand for services, and emergency response requirements (McPherson and Brown 2004;Freire 2007;Qi et al. 2015;Giovenco 2024).
Daytime population includes both residents engaged in daily mobility and non-resident visitors. It can be divided into primary movements—fixed in time and space, such as commuting to work and school—and consumer or discretionary movements, like shopping, leisure, and recreation, which vary according to personal needs (Todorić 2024;Gorný 2025;Bian and Wilmot 2015). These distinctions are essential in understanding urban dynamics and tailoring infrastructure and services.
The examination of population dynamics between two temporal reference points is undertaken through the application of index-based indicators. In the context of variations between nighttime and daytime populations, advanced statistical frameworks, such as those employed in Italy (ISTAT 2020) and Korea (KNGII 2021), utilize analogous indicators, albeit under differing terminological conventions. The coexistence index is the ratio between the daytime population and the resident population in the territorial domain of interest. It quantifies the imbalance between the population using the territory and the resident population (ISTAT 2020). The daytime population index is the ratio of the daytime population to the registered population and is a demographic factor that well expresses the characteristics of a region. The daytime population is calculated by adding the commuting population from other regions to the registered population of the region and subtracting the population commuting to other regions. Areas with a daytime population index of 100 or less indicate mainly residential areas (KNGII 2021).
Recent methodological advances integrate multiple data sources for diurnal population estimation. Key approaches include: (1) land-use–based models with census disaggregation (Kuffer and Sliuzas, 2014;Qi et al. 2015), (2) mobile device and location-based service data for capturing real-time flows (Oh and Park 2023;Güller and Varol 2024), (3) smart-card transit data for high temporal resolution (Ma et al. 2017), and (4) 3D urban models and building-level geodata for detailed allocation (Mileu and Queirós 2022;Wang et al. 2022). These methods improve spatial-temporal accuracy and reduce costs compared to traditional surveys (Potić 2024).
Applications range from optimizing emergency evacuation and shelter capacity to supporting economic planning and assessing commercial area vitality (McPherson and Brown 2004;Freire 2007;Bian and Wilmot 2015;ISTAT 2020). Empirical studies consistently show daytime populations concentrating in business and commercial districts, while nighttime densities peak in residential areas (Bhaduri 2017;Guest 1976). Land-use composition further shapes these patterns, with mixed-use and commercial areas exhibiting varying levels of day–night attractiveness (Kuffer & Sliuzas 2014;Qi et al. 2015). A hybrid approach—combining open geospatial building data and 3D models for nighttime estimation with dynamic datasets (mobile signals, smart-card data, points of interest) for daytime profiling—offers the most robust framework (Mileu and Queirós 2022;Wang et al. 2022;Giovenco 2024).
3 METHODOLOGY
The methodology of this study is based on using data from different types of sources, their cross-referencing, analysis and visualization (Figure 1).
Figure 1. Workflow chart
3.1 STUDY AREA
The research area encompasses the urban settlements of Belgrade, Novi Sad, and Niš (Zakon o teritorijalnoj organizaciji Republike Srbije, 129/2007, 18/2016, 47/2018, 9/2020). Although these settlements constitute parts of higher-level administrative units bearing the same names (City of Belgrade, City of Novi Sad, and City of Niš), this study exclusively examines the redistribution of population within the boundaries of their urban cores, i.e., the settlements themselves.
Intra-settlement dynamics were included in the analysis for Belgrade and Niš, which, unlike other settlements in the Republic of Serbia, extend over the territories of multiple municipalities. The settlement of Belgrade forms part of the City of Belgrade and comprises the entire territories of six urban municipalities (Vračar, Stari Grad, Savski Venac, Zvezdara, Rakovica, and Novi Beograd) as well as parts of four additional municipalities (Voždovac, Zemun, Palilula, and Čukarica). The settlement of Niš, as part of the City of Niš, spans across parts of four out of five urban municipalities (Crveni Krst, Pantelej, Palilula, and Medijana). For the purposes of the intra-settlement analysis, each segment of a settlement (identified by the name of the municipality to which it partially or fully belongs) was considered a separate analytical unit. In cases where only a part of a municipality fell within the settlement under observation (four in the case of Belgrade and all four in the case of Niš), only that portion was included in the analysis. Unlike Belgrade and Niš, the settlement of Novi Sad does not have a divided territory and was analysed as a single territorial unit.
3.2 DAYTIME AND NIGHTTIME POPULATION
The application of spatiotemporal population distribution models, specifically determining the difference between the daytime and nighttime populations, represents one form of analysis of daily mobility of the labour force. Through spatiotemporal population distribution, it is possible to identify work centres in a specific area, define their hierarchy, determine the degree of functional dependence of other settlements on these centres, and identify settlements with a dominant residential function, known as “bedroom communities.” Additionally, changes in the function of settlements over the observed period of time can be examined (Filipović 2020).
For the purposes of this study, the analysis focused on the contingent of temporary population based on daily labour force mobility. Compared to other types of movements, commuting constitutes the most prevalent, regular, and statistically reliable form of daily mobility (Tošić 2018;Krunić 2012). Consequently, the results obtained can serve as the most stable basis for defining daytime population, which can be further supplemented with additional components and adapted to the specific characteristics of the study area and temporal framework.
To determine the daily population and accompanying indicators, a basic calculation methodology based on the daily mobility of workers was adapted (Esri Data Development, 2025). The nighttime population (Pn) is expressed within the model as the number of inhabitants according to the census (Pt), recorded based on their place of residence (Pn=Pt). The daytime population (Pd) represents the population that predominantly resides in the settlement during working days and consists of the net population participating in daily mobility (Net commuting) and the enumerated population. To determine the number of the daytime population, the number of commuters (workers), according to separate data processing by the Statistical Office of Serbia (SORS 2025), was used. Using a matrix representation of the number of residents coming (in-commuters) to and leaving the settlement (out-commuters), the total number of residents moving between settlements was determined, and it can be mathematically represented by Equation (1):
Where Nc is net commuting, Cin is in-commuters and Cout is out-commuters.
Adding or subtracting this number from the number of usual population, the number of daytime population was established for each settlement, and it can be mathematically represented by Equation (2):
Where Pd is daytime population, Pn is nighttime population and Nc is net commuting.
The obtained value is greater than the one recorded by the census where the settlement has an in-commuting character, or lower where it has an out-commuting character (Krunić 2012;Lukić 2022). Settlements with an in-commuting character are associated with a work function, while settlements with an out-commuting character primarily serve as residential areas.
Based on the examples of Korea (KNGII 2021) and Italy (ISTAT 2020), the observed change from nighttime to the daytime population is presented through the diurnal population change index (Idpc) for all selected settlements, and it can be mathematically represented by Equation (3):
While the absolute change (Pch) highlights the significance for both work centres and settlements supplying commuters, and it can be mathematically represented by Equation (4):
A value of the index greater than 100 indicates settlements with a dominant work function, while values below 100 indicate settlements with a residential function (KNGII 2021). The spatiotemporal population distribution is examined at the settlement level for Novi Sad and settlement and intra-settlement level for Niš and Belgrade.
3.3 URBAN ATLAS
For the analysis of intra-settlement distribution of nighttime and daytime population, in addition to the processed census data, geospatial data on land cover and land use derived from the European Union initiative Urban Atlas (EEA 2020) have been utilized. The Urban Atlas data (hereinafter UA) is currently available for three temporal series: 2006 (EEA 2015), 2012 (EEA 2016a), and 2018 (EEA 2020)). This study focuses on the data from 2018 to ensure greater compatibility with the 2022 census data, although a significant difference is noticeable in the population dynamics and land use change dynamics. Specifically, while urban areas, even in large cities, are experiencing dynamic and relatively unbalanced changes in land use and urban expansion, the overall population is growing more slowly, or in most cases, it is stagnating or even decreasing. Notably, The European Urban Atlas provides high-resolution land use and land cover data for 788 Functional Urban Areas (FUAs) for the reference year 2018 in 39 countries of European Economic Area. Preliminary research on the potential application of these data in spatial and urban planning in Serbia has already been conducted (Gajić and Krunić 2020). It is significant that the UA data include information not only on land cover and land use, but also on population estimates for each polygon according to land use categories (Batista e Silva and Poelmann 2016), as well as on road networks and building heights. The initial definition of the percentage share of the nighttime population in Belgrade, Novi Sad, and Niš relied on the original estimates from the UA, which were subsequently slightly adjusted. Population estimates employ a dasymetric approach in modelling spatial population distribution. Dasymetric approaches utilizing different methods have been applied multiple times in studies and models of spatial population distribution in Serbia (Krunić et al., 2011; Bajat, Krunić and Kilibarda, 2011; Bajat et al., 2011;Bajat et al., 2013; Krunić, Bajat and Kilibarda 2015; Krunić et al., 2015), as well as in the analysis of the urban system and urban development of North Macedonia (Gajić Protić, Krunić and Srnić, 2024).
The UA geospatial data were obtained through a combination of statistical classification and visual interpretation of high-resolution multispectral satellite imagery (ranging from 2 to 2.5 meters), further enriched with additional information from other available sources (e.g., Google Earth (Google 2020), Open Street Map (OpenStreetMap Contributors 2017), etc.). The UA classification of land cover and land use classes is generally based on the CORINE land cover (CLC) classification (EEA 2016b), but with additional diversification of built up areas, detailed scale (1:10,000), data about population density per land use classes added, and encompasses 27 land cover classes distributed into five main thematic groups and four hierarchical levels.
For the analysis presented in this study, the following classes were selected (EEA 2016b) since they encompass more than 95% of the population, while the remaining classes have minimal participation in the population distribution:
• Continuous urban fabric (S.L.: > 80%) – Predominant residential use: areas with a high degree of soil sealing, independent of their housing scheme (single family houses or high-rise dwellings, city centre or suburb). Included are downtown areas and city centres, as well as Central Business Districts (CBD) as long as they are partially used for residential purposes.
• Discontinuous dense urban fabric (S.L.: 50% – 80%) – Predominant residential usage. Contains more than 20% non-sealed areas, independent of their housing scheme (single family houses or high-rise dwellings, city centre or suburb). The non-sealed areas might be private gardens, or common green areas.
• Discontinuous medium density urban fabric (S.L.: 30% – 50%) – Residential buildings, roads and other artificially surfaced areas. The vegetated areas are predominant, but the land is not dedicated to forestry or agriculture.
• Discontinuous low density urban fabric (S.L.: 10% – 30%) – Residential buildings, roads and other artificially surfaced areas. The vegetated areas are predominant, but the land is not dedicated to forestry or agriculture.
• Discontinuous very low density urban fabric (S.L.: < 10%) – Residential buildings, roads and other artificially surfaced areas. The vegetated areas are predominant, but the land is not dedicated to forestry or agriculture. Example: exclusive residential areas with large gardens.
• Isolated structures – Artificially isolated structures with a residential component, such as (small) individual farmhouses and related buildings.
• Industrial, commercial, public, military and private units – Industrial, commercial, public, military or private units. The administrative boundaries of the production or service unit are mapped, including associated features larger than the MMU (e.g. sports areas or transport structures).
The obtained data were subsequently mapped using the ArcGIS Pro software package (Esri Inc. n.d.). For enhanced visualization of changes by land-use categories and time-of-day periods, 3D maps were also incorporated.
4 RESULTS
According to the results of the 2022 Population Census, the territory of the Republic of Serbia had 795,779 active residents participating in commuting. This number represented 12% of the total population of the country (excluding data for Kosovo and Metohija) and 28.4% of all active individuals engaged in employment (SORS 2025). In comparison to the previous Census in 2011, which recorded 615,990 workers engaged in this form of movement, there was an increase of over 180,000, or nearly 30%. This phenomenon has accentuated the demographic trend documented in the first intercensal period of the 21st century, characterized by an approximate 10% escalation in the volume of commuters (Filipović 2020). Considering the decrease in the overall population of Serbia and the contingent of employed individuals during the mentioned period, the share of commuters becomes even more significant. Based on such a trend, the difference between daytime and nighttime populations of specific settlements and their parts gains importance.
Within the territory of Serbia, and in accordance with patterns of daily mobility of the employed population, settlements were identified where the daytime population significantly exceeded the nighttime population. The selected centres of work differ in terms of type, significance and spatial distribution within the settlement network of Serbia. As with most demographic indicators, the city of Belgrade takes the lead in this type of spatial-temporal population distribution, with a difference of 112,309 between daytime and nighttime populations. Besides the capital, other notable centers with differences exceeding 10,000 residents include Niš and Novi Sad (Table 1). For the remaining selected settlements, the difference between daytime and nighttime populations is at a significantly lower level in absolute terms.
| Municipality | Nighttime population | Daytime population | Change | Index DPC |
|---|---|---|---|---|
| Voždovac | 155,909 | 135,196 | -20,713 | 86.7 |
| Vračar | 55,406 | 67,751 | 12,345 | 122.3 |
| Zvezdara | 172,625 | 137,084 | -35,541 | 79.4 |
| Zemun | 166,049 | 155,542 | -10,507 | 93.7 |
| Novi Beograd | 209,763 | 264,985 | 55,222 | 126.3 |
| Palilula | 113,883 | 116,241 | 2,358 | 102.1 |
| Rakovica | 104,456 | 77,386 | -27,070 | 74.1 |
| Savski venac | 36,699 | 97,815 | 61,116 | 266.5 |
| Stari grad | 44,737 | 93,827 | 49,090 | 209.7 |
| Čukarica | 138,187 | 113,233 | -24,954 | 81.9 |
| BELGRADE Total | 1,197,714 | 1,310,023 | 112,309 | 109.4 |
| Pantelej | 36,354 | 29,255 | -7,099 | 80.5 |
| Crveni krst | 11,970 | 20,230 | 8,260 | 169.0 |
| Medijana | 78,470 | 88,079 | 9,609 | 112.2 |
| Palilula | 52,182 | 45,373 | -6,809 | 87.0 |
| NIŠ Total | 178,976 | 194,352 | 15,376 | 108.6 |
| NOVI SAD Total | 260,438 | 297,397 | 36,959 | 114.2 |
| Source: SORS 2025. (Total=settlement) | ||||
Furthermore, within the settlements of Belgrade and Niš themselves, which are divided into multiple urban municipalities, internal commuting can be analysed in the context of changes between nighttime and daytime population. This aspect is further explored in the concluding section of this study. The aforementioned findings (Živanović et al. 2021;Filipović, Krunić and Zhelenkova 2022) underscore the need for a more comprehensive analysis of temporary population changes within the daily urban systems of Novi Sad, Niš, and particularly Belgrade, as it represents the most prominent centre in the Serbian territory.
Therefore, taking into account the net commuting, enumerated population and land cover classes with the highest population, a highly simplified model of intra-urban redistribution was created (Table 2).
| Land use | Area, ha | % N_POP | % D_POP | Total N_POP | Total D_POP | Density N_POP/ha | Density D_POP/ha |
|---|---|---|---|---|---|---|---|
| BELGRADE | |||||||
| Continuous urban fabric (S.L. : > 80%) | 1,648.0 | 29 | 37 | 347,337 | 465,852 | 210.8 | 282.7 |
| Discontinuous dense urban fabric (S.L. : 50% – 80%) | 4,391.5 | 46 | 24 | 550,948 | 302,174 | 125.5 | 68.8 |
| Discontinuous medium density urban fabric (S.L. : 30% – 50%) | 2,165.2 | 14 | 8 | 167,680 | 100,725 | 77.4 | 46.5 |
| Discontinuous low density urban fabric (S.L. : 10% – 30%) | 905.9 | 4 | 2 | 47,909 | 25,181 | 52.9 | 27.8 |
| Discontinuous very low density urban fabric (S.L. : < 10%) | 410.7 | 1 | 1 | 11,977 | 12,591 | 29.2 | 30.7 |
| Isolated structures | 59.9 | 1 | 0 | 11,977 | 0 | 200.0 | 0.0 |
| Industrial, commercial, public, military, private units, and all others* | 3,453.1 | 5 | 28 | 59,886 | 352,537 | 17.3 | 102.1 |
| NOVI SAD | |||||||
| Continuous urban fabric (S.L. : > 80%) | 519.2 | 36 | 46 | 93,758 | 136,803 | 180.6 | 263.5 |
| Discontinuous dense urban fabric (S.L. : 50% – 80%) | 1,075.2 | 48 | 14 | 125,010 | 41,636 | 116.3 | 38.7 |
| Discontinuous medium density urban fabric (S.L. : 30% – 50%) | 203.3 | 6 | 6 | 15,626 | 17,844 | 76.9 | 87.8 |
| Discontinuous low density urban fabric (S.L. : 10% – 30%) | 66.9 | 1 | 2 | 2,604 | 5,948 | 38.9 | 88.9 |
| Discontinuous very low density urban fabric (S.L. : < 10%) | 1,080.8 | 3 | 32 | 7,813 | 95,167 | 7.2 | 88.1 |
| Isolated structures | 228.4 | 1 | 2,604 | 0 | 11.4 | 0.0 | |
| Industrial, commercial, public, military, private units, and all others* | 7,312.9 | 2 | 5,209 | 0 | 0.7 | 0.0 | |
| NIŠ | |||||||
| Continuous urban fabric (S.L. : > 80%) | 446.9 | 48 | 56 | 85,908 | 102,445 | 192.2 | 229.2 |
| Discontinuous dense urban fabric (S.L. : 50% – 80%) | 604.6 | 39 | 14 | 69,801 | 25,611 | 115.4 | 42.4 |
| Discontinuous medium density urban fabric (S.L. : 30% – 50%) | 156,8 | 6 | 6 | 10,739 | 10,976 | 68.5 | 70.0 |
| Discontinuous low density urban fabric (S.L. : 10% – 30%) | 80.0 | 2 | 1 | 3,580 | 1,829 | 44.8 | 22.9 |
| Discontinuous very low density urban fabric (S.L. : < 10%) | 106.9 | 1 | 1 | 1,790 | 1,829 | 16.7 | 17.1 |
| Isolated structures | 3.0 | 0 | 0 | 0.0 | 0.0 | ||
| Industrial, commercial, public, military, private and all others* | 712.6 | 4 | 22 | 7,159 | 40,246 | 10.0 | 56.5 |
|
*This type of land use class includes all other land uses with a very small amount of population and share of less than 1% of the total population.
Source: SORS 2025 (N_POP-nighttime population; D_POP-daytime population) |
|||||||
4.1 BELGRADE
The settlement of Belgrade is traditionally the most influential urban centre in Serbia, serving as the nucleus of the most significant daily urban system (Filipović, Krunić and Zhelenkova 2022). In addition to its status as the capital city, Belgrade represents the most populous settlement and extends its sphere of influence beyond national borders. It is divided into 10 distinct settlement areas, which either entirely or partially correspond to urban municipalities (Voždovac, Vračar, Zvezdara, Zemun, Novi Beograd, Palilula, Rakovica, Savski venac, Stari grad, and Čukarica). The population of Belgrade, specifically its nighttime residents, was reported at 1,197,714 individuals according to the 2022 Census. Within this active population, 34,681 individuals with professional engagement outside the settlement, constituted a contingent of commuters. On the other hand, within the Belgrade’s territory, 146,990 residents from other settlements were employed, resulting in the total daily population of 1,310,023 individuals. The diurnal population change index stood at 109.4 across the entire settlement of Belgrade.
Within the Belgrade settlement itself, distinct variations in spatial distribution between daytime and nighttime populations are observed. With Belgrade being divided into ten parts corresponding to different municipalities, five areas exhibited greater presence of daytime population (Vračar, Novi Beograd, Palilula, Savski venac and Stari grad), while the remaining five areas demonstrated a more significant concentration of nighttime residents (Voždovac, Zvezdara, Zemun, Rakovica, and Čukarica). The highest influx of population during the day was registered in Savski venac (61,116) and Novi Beograd (55,222). The diurnal population change index reached its peak in the previously mentioned Savski Venac (266.5) and another central municipality, that of Stari Grad (209.7). Opposite to that, Zvezdara experienced the most substantial decrease in population during the day compared to the census figures (35,541). Other settlement parts with nighttime population exceeding 20,000 residents included Voždovac (20,713), Rakovica (27,070) and Čukarica (24,954). Rakovica had the lowest diurnal population change index value (74.1) among all parts of Belgrade.
Significant differences in the distribution of nighttime and daytime populations in Belgrade were observed according to anthropogenic land cover classes (Figure 2a; 2b). The usual population, that is nighttime population, was the most numerous in discontinuous areas with high-density urban fabric, with around 551,000 inhabitants, accounting for 46% of the population. Continuous urban fabric (29%) and discontinuous areas with medium-density urban fabric (14%) also had significant shares in these distribution findings. The highest concentration of daytime population was registered in continuous urban fabric with around 466,000 inhabitants (37%). The diurnal population change index for this category had a value of 134, and the population density during the day was 283 per ha. Industrial, commercial, public and business zones were another focal point of daytime population concentration, within which these zones accounted for 28% of the total, or almost six times larger than the nighttime population. All classes of discontinuous urban fabric experienced a decrease in the daytime population compared to the nighttime population.
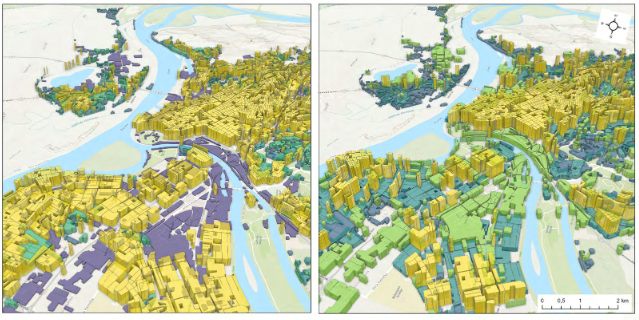
Figure 2a. Spatial distribution of the nighttime (left) and daytime (right) population of Belgrade (the detail covering central part of the urban area)
Figure 2b. Spatial distribution of the nighttime (left) and daytime (right) population of Belgrade (the detail covering central part of the urban area) showed in 3D for better recognition of the changes in redistribution. Note: Due to the size of the urban core of Belgrade, it is not possible to show it in its entirety in this format, therefore the central part with the surroundings, where the most significant changes are taking place, is shown
4.2 NOVI SAD
Novi Sad represents the most influential centre north of Belgrade and is thus the core of the largest daily urban system in that part of Serbia. According to the data from the 2022 Census, the settlement itself was populated by 260,438 inhabitants, which in this case is considered the nighttime population. Based on the number of residents, Novi Sad represents the second most populous centre on the entire territory of Serbia. Out of its total inhabitants, 21,668 commuters were employed in another settlement, while on the other hand, 58,627 commuters from other settlements were employed in Novi Sad. This led to a 14.2% increase in the number of people residing in the observed centre on a daily basis, compared to the population determined by the census. By considering the commuting population of Novi Sad (297,397), with a change index of 114.2 in relation to the nighttime population, an additional 36,959 individuals can be accounted for.
Almost half of the nighttime population, that is the usual population of Novi Sad (48%), resided in discontinuous high-density urban fabric (Figure 3a; 3b). This contingent consisted of around 125,000 inhabitants, or 116 individuals per ha. Another influential share of the nighttime population (36%) was found in continuous urban fabric, accounting for nearly 85% of the population of Novi Sad when combined with the previous category. The highest proportion of the daytime population was concentrated within the continuous urban fabric (46%), where the number of inhabitants increased by 46% compared to the nighttime population. Industrial, commercial, public, and business zones involved a significant concentration of 35% of the daytime population. The intensity of change was the most dominant in this category, with the daytime population concentration being nearly 12 times higher than that of the nighttime population. However, a decrease in population concentration at the daytime level was observed in the areas of discontinuous built-up land.
Figure 3a. Spatial distribution of the nighttime (left) and daytime (right) population of Novi Sad
Figure 3b. Spatial distribution of the nighttime (left) and daytime (right) population of Novi Sad showed in 3D for better recognition of the changes in redistribution
4.3 NIŠ
Niš, the most prominent urban centre in the Southern and Eastern Serbia region, serves as the core of the most significant daily urban system in that part of the country. The city encompasses four municipal districts (Mediјana, Panteleј, Palilula and Crveni Krst) and is regarded a central hub for commuters. According to the 2022 Census data, Niš had a usual population of 178,976 individuals, including both of commuters and nighttime residents. Out of the total population, 10,039 individuals were identified as commuters based on the census methodology, representing active residents of Niš who commuted to work to other areas. Contrary to that, 25,415 residents from neighbouring settlements were employed in Niš, contributing to a daytime population of 194,352. The diurnal population change index for Niš in 2022 was 108.6.
Niš itself exhibits significant territorial distribution differences in daytime and nighttime population across its various parts, belonging to different municipal districts. As the urban core of Niš is divided into four parts, greater daytime population influence was observed in the parts belonging to the Crveni Krst and Mediјana municipal districts, while nighttime population predominated in the parts belonging to the Palilula and Panteleј municipal districts. The most significant absolute change from nighttime to daytime population was recorded in the Mediјana municipal district. During the day, this part of Niš experienced an increase of 9,609 individuals compared with the number of residents determined by the census. The index of change from nighttime to daytime population reached its highest value of 169 in the part of Niš belonging to the Crveni Krst municipal district. Opposite to that, the largest absolute decrease in daytime population (-7,099) was registered in the part of the urban core belonging to the Pantelej municipal district, while the lowest index value of 80.5 was observed in the same part of the Niš settlement.
Among the observed settlements, Niš exhibited the highest concentration of both nighttime and daytime populations in the same anthropogenic land cover category (Figure 4a; 4b). Around 86,000 residents of Niš lived in the continuous urban fabric, representing 56% of the nighttime population. At the daytime level, this number fluctuated with an index of 119, comprising a half of the daytime population, with the density of 229 persons per ha. Approximately significant concentration of the nighttime population (39%) was observed in the discontinuous high-density urban fabric, whereas the second most significant concentration of the daytime population (22%) was in the industrial, commercial, public and business zones. In these zones, the population increased approximately 11 times during the day, while it decreased in relation to the nighttime population in the discontinuous urban fabric categories.
Figure 4a. Spatial distribution of the nighttime (left) and daytime (right) population of Niš
Figure 4b. Spatial distribution of the nighttime (left) and daytime (right) population of Niš (the detail covering central part of the urban area) showed in 3D for better recognition of the changes in redistribution
It should also be noted that the differences in the distribution of daytime and nighttime populations are also a consequence of the urban morphological structure of the settlements themselves and land use patterns. In the areas with more pronounced divisions between work zones and residential areas, more significant shifts in the commuter population are observed, a conclusion of great importance for urban planners and decision-makers.
5 DISCUSSION
One of the main objectives of this study is the application of diverse analytical tools to achieve a deeper understanding of the spatiotemporal patterns of population mobility. For this reason, among others, an integration and cross-application of different types of data sources have been carried out, so as to obtain the clearest possible picture of the spatiotemporal distribution of the population. Previous research has employed the concept of combining population data with land-use information, both in Serbia (Gajić and Krunić 2020) and in the wider region (Gajić Protić et al. 2024); however, the specificity of this study lies in the fact that, for the first time in Serbia, such an approach has been implemented, which used data on one form of temporary population. Furthermore, the delineation of work zones and residential zones through the application of the diurnal population change index has proven to be suitable across different territorial levels. Until now, the application of this type of index has encompassed FUA, municipal, and settlement levels (KNGII 2021;ISTAT 2020). By incorporating data at finer territorial scales, namely sub-settlement units, the index can also be employed to identify functional differentiation within a single settlement.
The results of this study clearly demonstrate that Serbia’s three largest urban centres—Belgrade, Novi Sad, and Niš—play a disproportionately dominant role in structuring daily mobility. The redistribution between daytime and nighttime populations in these cities not only confirms the general patterns documented internationally (Charles-Edwards et al. 2020;Qi et al. 2015;Brollo and Celata 2022), but also highlights the unique features of Serbia’s post-socialist urban transformation, particularly the pronounced centralisation of employment and services. These urban centres exhibit a clear concentration of daytime population in the commercial and administrative cores, accompanied by the depopulation of residential zones during working hours. However, the degree of centralisation observed in Serbia—especially in Belgrade—is considerably higher than in the majority of polycentric urban systems.
The most significant centres of daily mobility are characterised by a highly polarised geospatial pattern in Serbia, with Novi Sad, Niš, and particularly Belgrade emerging as key employment hubs, exhibiting the most notable positive daily changes in the size of population. The dominant employment function of these settlements also shapes the function and spatial orientation of the surrounding settlements within their respective daily urban systems. While major employment centres attract a substantial influx of population on a daily basis, the opposite process is observed in certain settlements located in close proximity, albeit to varying degrees.
Belgrade stands out as the country’s primary employment hub, attracting nearly 147,000 inbound commuters daily, equivalent to 18.5% of all commuting workers in Serbia. This magnitude surpasses the combined total for Novi Sad and Niš and mirrors the primacy of capitals such as Budapest and Sofia (Živanović et al. 2019). Intra-urban analysis further reveals a strong spatial polarisation between work-oriented municipalities (Savski venac, Stari grad) and residential municipalities (Rakovica, Zvezdara), a pattern also found in Western European metropolitan areas (Mileu and Queirós 2022), though in Serbia these divisions are largely a legacy of the industrial-era zoning and post-socialist redevelopment.
According to preliminary analyses of the 2018 UA data, covering urban areas in 14 cities in Serbia (excluding Kosovo and Metohija, Belgrade, Novi Sad, Niš, Kragujevac, Subotica, Novi Pazar, Zrenjanin, Kraljevo, Čačak, Kruševac, Leskovac, Valjevo, Vranje, and Smederevo), and considering the official data from the Statistical Office of the Republic of Serbia (SORS) on population numbers, it was determined that approximately 4,251,300 individuals were part of some functional-urban areas of larger cities, accounting for about 61% of the estimated total population of Serbia in 2018. The ‘anthropogenic’ land classes (11100–14200) covered approximately 8% of the analysed areas, inhabited by around 4,032,600 people, or 95% of the total population of functional-urban areas in Serbia. The highest number of inhabitants was recorded in discontinuous areas with high (38%) and medium (24%) density urban fabric, as well as continuous urban fabric (14%), representing about 76% of the total population of functional-urban areas in Serbia. The average population density across the seven previously shown classes in Serbia is 37 persons/ha, with the highest population densities found in continuously urban fabric where the development percentage exceeds 80%, reaching as high as 138 persons/ha. In discontinuous zones, population density ranged from 61 persons/ha in high-density areas to 4 persons/ha in very low-density urban fabric.
The integration of Urban Atlas land-use data into this analysis provided a deeper insight into the functional geography of daytime population shifts. Continuous urban fabric and industrial/commercial/public zones emerge as the dominant attractors of daytime population, while all categories of discontinuous urban fabric lose residents during the day. This aligns with the findings of Qi et al. (2015) in Beijing and Jo, Lee and Kim (2020) in Seoul, where mono-functional zones experience the most extreme diurnal population changes, whereas mixed-use areas maintain a more balanced day–night ratio. In Belgrade, the daytime population in industrial and commercial areas is nearly six times greater than the nighttime figure, while in Niš the increase reaches eleven-fold, reflecting a high level of functional specialisation. In the vicinity of Novi Sad, this is the case with the discontinuous very low density urban fabric, that is, with the first adjacent category, which indicates relationships similar to those observed in the remaining two urban centres.
While these patterns are consistent with global research, the methodology applied in Serbia remains largely reliant on static census data and periodic GIS updates. This approach limits the ability to detect short-term, weekly, or seasonal fluctuations in daily mobility, a limitation repeatedly highlighted in the literature (McPherson and Brown 2004;Kobayashi, Medina and Cova 2011;Panczak, Charles-Edwards and Corcoran 2020). In contrast, recent studies in Australia (Charles-Edwards 2016), South Korea (Oh and Park 2023), and Italy (Brollo and Celata 2022) have incorporated dynamic datasets—mobile phone records, GPS traces, and smart-card transit data—to capture real-time and seasonal variability. Such methods offer higher temporal granularity and allow planners to model scenarios, such as peak commuting periods or emergency evacuations, with greater precision.
Another dimension, confirmed in both Serbian and international contexts, is the close relationship between commuting patterns and the broader socio-economic landscape. In Serbia, high housing costs in central urban zones, combined with uneven regional economic development, continue to drive long-distance commuting (Lukić 2011a; 2022), echoing patterns seen in Italian cities where temporary populations are driven not only by labour mobility but also by student migration and tourism (Brollo and Celata 2022). However, in the Serbian case, labour mobility is the overwhelmingly dominant factor, making the observed redistribution more stable over time but less flexible in responding to sudden economic or infrastructural changes.
Combining advanced technologies with traditional demographic methods offers transformative potential for urban planning and public health (Potić 2024). The applied 3D visualization approach to the spatial distribution of population, based on the collected data, yielded clearer results in the cases of Niš and Novi Sad, primarily due to their smaller territorial scope. Therefore, to enhance applicability, it is proposed that the method be extended to individual sections of Belgrade, as well as to other settlements included in the Urban Atlas. This is consistent with the approach taken in metropolitan-scale studies in Lisbon and Porto (Mileu and Queirós 2022), where high-resolution 3D mapping was used to support urban policy decisions.
From a practical standpoint, the implications of these findings are substantial. For transport planning, understanding the spatial distribution of daytime populations enables optimisation of public transport capacity, dynamic traffic management, and targeted development of cycling and pedestrian infrastructure in high-fluctuation areas. For emergency management, as in Japan and the United States (McPherson and Brown, 2004;Kobayashi, Medina and Cova 2011), daytime population models can guide the location of emergency services, evacuation route planning, and risk assessments. In the economic sphere, daytime population data are essential for estimating the potential of retail, hospitality, and cultural sectors, as well as for revitalising central business districts through mixed-use development to reduce extreme diurnal fluctuations.
Overall, the Serbian case confirms the utility of the temporary population concept for understanding urban dynamics, while also underlining the urgent need to modernise the data collection and analysis methods. The integration of dynamic, high-frequency datasets would not only enhance the accuracy and timeliness of such analyses, but also facilitate meaningful international comparisons and evidence-based policymaking. In line with the broader literature (Panczak, Charles-Edwards and Corcoran 2020), the next step is to embed these models into the operational tools of urban governance, ensuring that infrastructure, services, and risk management systems are designed for the realities of how populations actually inhabit and move through urban space.
6 CONCLUSION
The spatiotemporal analysis of the differences between daytime and nighttime populations in Serbian settlements, based on the 2022 Population Census and geospatial land-use data, confirmed that daily population mobility is one of the key factors shaping the functional structure of urban areas. The largest differences between daytime and nighttime populations were recorded in Belgrade, Novi Sad, and Niš, indicating their dominant role as employment centres at the national level.
The applied Diurnal Population Change Index enabled the identification of settlements with predominantly work-oriented or residential functions. Settlements with high index values (>100) experience a net inflow of commuters during the day and are characterised by a concentration of employment activities, while those with values below 100 are primarily residential and act as “suppliers” of labour. Spatial differences in population concentration between day and night are most pronounced in the areas of continuous urban fabric and in the industrial–commercial zones, a pattern particularly evident in Belgrade.
The results point to the need of enhancing planning and management policies that incorporate the concept of temporary population. Urban governance, infrastructure sizing, public transport planning, and emergency management must be based not only on the permanent population, but also on actual daily population flows. Moreover, the application of integrated data sources—census, functional, and geospatial—proves to be a valuable approach in defining contemporary urban systems and both intra- and inter-urban connectivity.
In this regard, the study demonstrates the value of combining Urban Atlas land-use classifications with demographic data to achieve a more precise functional interpretation of spatial patterns. The visualisation of these differences through 3D models has further proven to be a powerful analytical tool, enabling the clear identification of “hotspots” of daytime activity and offering decision-makers an intuitive means to assess and communicate urban dynamics. Such integration of thematic geospatial data with advanced visualisation techniques not only improves analytical precision, but also strengthens the applicability of findings in operational urban planning and policy-making.
In this context, the present study provides a basis for further research on temporary populations and commuting as spatial–functional phenomena, contributing to the development of methodological tools and indicators applicable in demographic, spatial, and urban planning analyses.
The funds for the research presented in this paper were provided by the Ministry of Science, Technological Development, and Innovation of the Republic of Serbia, registration number: 451–03–136/2025–03/200172 and 451-03-66/2025-03/200006. Data from the 2022 Census (SORS 2025), additionally processed by the Statistical Office of the Republic of Serbia, Belgrade, upon the author’s personal request and exclusively for the purposes of this study.
Data availability statement
Data are available from the author upon request.
References
- Bajat, B., Krunić, N., & Kilibarda, M. (2011) Dasymetric mapping of spatial distribution of population in Timok Region. In: Proceedings of International Scientific Conference Professional Practice and Education in Geodesy And Related Fields, 24th-26th Jun 2011, Kladovo, Serbia. pp 30–34.
- Bajat, B., Krunić, N., Kilibarda, M., & Samardžić-Petrović, M. (2011). Spatial prediction of Human Population Change. Paper presented at AGILE International Conference on Geographic Information Science, Utrecht, Netherlands, 18–21 April 2011.
- Bajat, B., Krunić, N., Samardžić-Petrović, M., & Kilibarda, M. (2013). Dasymetric modelling of population dynamics in urban areas. Geodetski vestnik, 57(4), 777–792. https://doi.org/10.15292/geodetski-vestnik.2013.04.777–792 ; https://www.geodetski-vestnik.com/arhiv/57/4/gv57-4_bajat.pdf
- Batista e Silva, F. and Poelman, H. (2016) Mapping population density in functional urban areas: a method to downscale population statistics to urban atlas polygons, Publications Office. https://data.europa.eu/doi/10.2791/06831
- Bhaduri, B. (2017). Population Distribution During the Day. In: S. Shekhar, H. Xiong, X. Zhou, (Eds) Encyclopedia of GIS. (pp. 1607–1614). Springer, Cham. https://doi.org/10.1007/978-3-319-17885-1_1005
- Bian, R., & Wilmot, C. G. (2015). Spatiotemporal Population Distribution Method for Emergency Evacuation: Case Study of New Orleans, Louisiana. Transportation Research Record, 2532(1), 99–106. https://doi.org/10.3141/2532-12
- Brollo, B., & Celata, F. (2022). Temporary populations and sociospatial polarisation in the short-term city. Urban Studies, 60(10), 1815–1832. https://doi.org/10.1177/00420980221136957
- Charles-Edwards, E. (2016). The Estimation of Temporary Populations in Australia. In: Wilson, T., Charles-Edwards, E., Bell, M. (Eds) Demography for Planning and Policy: Australian Case Studies. Applied Demography Series, vol 7. (pp. 31–49). Springer, Cham. https://doi.org/10.1007/978-3-319-22135-9_3
- Charles-Edwards, E., Bell, M., Panczak, R., & Corcoran, J. (2020). A Framework for Official Temporary Population Statistics. Journal of Official Statistics, 36, 1–24. https://doi.org/10.2478/jos-2020-0001
- Choorat, W., Sawangdee, Y., Punpuing, S., & Piotrowski, M. (2025). Understanding Commuting Mode Choices in Bangkok: The Role of Sociodemographics and Urban Structure in Shaping Transportation Preferences. Journal of Population and Social Studies [JPSS], 34(-), 217–235. retrieved from https://so03.tci-thaijo.org/index.php/jpss/article/view/283131
- Čaušević, A. (2023). Impact of the COVID-19 Pandemic on Travel Behavior and Travel Mode Preferences: The Example of Bosnia and Herzegovina. Sustainability, 15(13), 10701. https://doi.org/10.3390/su151310701
- Duarte, C.M. & Fernández, M.T. (2017). The influence of urban structure on commuting: An analysis for the main metropolitan systems in Spain. Procedia Engineering, 198, 52–68. https://doi.org/10.1016/j.proeng.2017.07.073
- EEA. (2015). Urban Atlas Land Cover/Land Use 2006 (vector), Europe, 6-yearly, Jul. 2015. European Environment Agency. https://doi.org/10.2909/551D6741-84D0-43FB-BDA8-1768D51BBB4C
- EEA. (2016a). Urban Atlas Land Cover/Land Use 2012 (vector), Europe, 6-yearly, Jan. 2021. European Environment Agency. https://doi.org/10.2909/DEBC1869-A4A2-4611-AE95-DAEEFCE23490
- EEA. (2016b) Mapping guide for a European Urban Atlas, v6.3. European Environment Agency, Copenhagen. https://land.copernicus.eu/en/technical-library/urban_atlas_2012_2018_mapping_guide/@@download/file
- EEA. (2020). Urban Atlas Land Cover/Land Use 2018 (vector), Europe, 6-yearly, Jul. 2021. European Environment Agency. https://doi.org/10.2909/FB4DFFA1-6CEB-4CC0-8372-1ED354C285E6
- Esri Inc. (n.d.). ArcGIS Pro (Version 3.1.1). In Esri Inc.
- Esri Data Development. (2025). Use and interpret daytime population data: Population expansions and contractions between day and night and how it impacts the daytime workforce [ArcGIS StoryMap]. ArcGIS. https://storymaps.arcgis.com/stories/8edbce2cb5584be3b3406432c17cf5f7
- Ferent, A. (2023). Airplane parts and Covid masks: labour commuters of North-western Romania between Central and Eastern European “re-industrialisation” and the global market. Studia Universitatis Babeș-Bolyai Sociologia, 68(1), 107–127. https://doi.org/10.2478/subbs-2023-0010
- Filipović, M. (2020). Dnevni migracioni sistem Beograda [Daily migration system of Belgrade; Unpublished doctoral dissertation]. Faculty of Geography, University of Belgrade. https://nardus.mpn.gov.rs/handle/123456789/18274
- Filipović, M., Krunić, N., & Zhelenkova, E. (2022). Functional dependence of settlements and its demographic component in the transition phase of the daily urban system. Journal of the Geographical Institute Jovan Cvijic, SASA, 72(3), 323–339. https://doi.org/10.2298/IJGI2203323F
- Freire, S. M. C. (2007). Modeling daytime and nighttime population distributions in Portugal using geographic information systems Doctoral dissertation, University of Kansas. https://hdl.handle.net/1808/3978
- Gajić, A., & Krunić, N. (2020). Primena podataka „Urban Atlas” u istraživanju i planiranju prostora: primer Beograda. In J. Petrić & M. Vujošević (Eds.), Teorijska, razvojna i primenjena istraživanja prostornih procesa za obnovu strateškog mišljenja i upravljanja u Srbiji (pp. 67–85). Beograd : Institut za arhitekturu i urbanizam Srbije. https://hdl.handle.net/21.15107/rcub_raumplan_829
- Gajić Protić, А., Krunić, N., & Srnić, D. (2024) Perspectives for the development of Urban Areas in the Republic of North Macedonia. Proceedings book 2024, 6th Congress of Macedonian geographers with international participation, 29–30 May 2024., Ohrid, N. Macedonia. https://doi.org/10.37658/mgd24119gp
- Giovenco, T. (2024). What is the difference between employees and daytime population from Experian CAPE. Alteryx Knowledge Base. Retrieved August 3, 2025, from https://knowledge.alteryx.com/index/s/article/What-is-the-difference-between-employees-and-daytime-population-from-Experian-CAPE-1583459125878
- Glavić, D., Trpković, A., Milenković, M., & Jevremović, S. (2023). Pandemic impact on traffic trends and patterns in the city of Belgrade. Transport, 38(3), 165–177. https://doi.org/10.3846/transport.2023.19375
- Google. (2020). Google Earth Pro 7.3.3.7786. In Geospatial Solutions [Computer software]. earth.google.com/web
- Gorný, D. (2025). At the intersection: the impact of work and university schedules on daily mobility of working students. Mobilities, 1–18. https://doi.org/10.1080/17450101.2025.2532398
- Guest, A.M. (1976). Nighttime and Daytime Populations of Large American Suburbs. Urban Affairs Review, 12, 57–82. https://doi.org/10.1177/107808747601200104
- Güller, C., & Varol, C. (2024). Unveiling the daily rhythm of urban space: Exploring the influence of built environment on spatiotemporal mobility patterns. Applied Geography, 170, Article 103366. https://doi.org/10.1016/j.apgeog.2024.103366
- Ilić, Ј. (1970). Karakteristike funkcionalnih odnosa između grada i okoline sa posebnim osvrtom na SR Srbiju. Stanovništvo, 3–4, 167–189.
- ISTAT. (2020). Daytime population for study and work: Year 2016. Istituto Nazionale di Statistica (ISTAT). Retrieved August 3, 2025, from https://www.istat.it/wp-content/uploads/2020/11/Daytime-population-2016.pdf
- Jo, A., Lee, S.-K., & Kim, J. (2020). Gender Gaps in the Use of Urban Space in Seoul: Analyzing Spatial Patterns of Temporary Populations Using Mobile Phone Data. Sustainability, 12(16), 6481. https://doi.org/10.3390/su12166481
- Jolley, J., Lane, B. & Brun, L. (2011) Economic Development Planning In Bedroom Communities: A Case Study of Chatham County, North Carolina. Journal of Rural and Community Development 6, 1. 113–128. https://journals.brandonu.ca/jrcd/article/view/444/107
- Kokotović Kanazir, V., Panić, M., & Drobnjaković, M. (2024). Value of people – human capital in Serbia through the prism of educational attainment of young population. Stanovnistvo, 62(S1), S105–S129. https://doi.org/10.59954/stnv.625
- Krunić, N., Bajat, B., Kilibarda, M., & Tošić, D. (2011). Modelling the spatial distribution of Vojvodina’s population by using dasymetric method. Spatium, 24, 45–50. https://doi.org/10.2298/SPAT1124045K
- Krunić, N. (2012). Prostorno funkcijski odnosi i veze u mreži naselja Vojvodine [Spatial-functional relations and links in the network of settlements of Vojvodina, Unpublished doctoral dissertation]. Faculty of Geography, University of Belgrade.
- Krunić, N., Bajat, B., & Kilibarda, M. (2015). Dasymetric Mapping of Population Distribution in Serbia Based on Soil Sealing Degrees Layer. In: K. Ružičková, & T. Inspektor, (Eds.) Surface Models for Geosciences. Lecture Notes in Geoinformation and Cartography (pp 137–149) Springer, Cham. https://doi.org/10.1007/978-3-319-18407-4_12
- Krunić, N., Milijić, S., Đurđević, J., Bakić, O., & Krstić, V. (2015). Dasymetric mapping of flood impact to the population in Serbia. Paper presented at 9th World Congress of EWRA Water Resources Management in a Changing World: Challenges and Opportunities”, Istanbul, Turkey.
- Kobayashi, T., Medina, R.M., & Cova, T.J. (2011). Visualizing Diurnal Population Change in Urban Areas for Emergency Management. The Professional Geographer, 63(1), 113–130. https://doi.org/10.1080/00330124.2010.533565
- KNGII. (2021). The National Atlas of Korea (Vol. III). Korean National Geographic Information Institute, Ministry of Land, Infrastructure and Transport. http://nationalatlas.ngii.go.kr/pages/page_2563.php?
- Kuffer, M., & Sliuzas, R.V. (2014). Modelling day and night time population using a 3D urban model. Proceedings Real Corp 2014 : 21–23 May 2014, Vienna, Austria. pp. 397–405. http://www.corp.at/archive/CORP2014_46.pdf
- Lukić V. (2011a). Demografski razvitak i funkcionalna struktura Pančeva. Geografski institut “Jovan Cvijić” SANU, Beograd
- Lukić V. (2011b). Commuting in the settlement system of Serbia. Stanovništvo 49(2): 25–50. https://doi.org/10.2298/STNV1102025L
- Lukić, V. (2022). Migration and Mobility Patterns in Serbia. In: Manić, E., Nikitović, V., Djurović, P. (eds) The Geography of Serbia: Nature, People, Economy (157–167). World Regional Geography Book Series. Springer, Cham. https://doi.org/10.1007/978-3-030-74701-5_12
- Ma, Y., Xu, W., Zhao, X., & Li, Y. (2017). Modeling the Hourly Distribution of Population at a High Spatiotemporal Resolution Using Subway Smart Card Data: A Case Study in the Central Area of Beijing. ISPRS International Journal of Geo-Information, 6(5), 128. https://doi.org/10.3390/ijgi6050128
- Matijević, D. (2009). Prostorno-funkcionalna povezanost naselja opštine Stara Pazova sa urbanim sistemom Beograda (Posebna izdanja 73) [Spatial-functional connection settlements of the municipality of Stara Pazova and Belgrade urban system (Special issue 73)]. Geographical Institute “Jovan Cvijić” SASA.
- McPherson, T.N. & Brown, M.J. (2004). Estimating daytime and nighttime population distributions in U.S. cities for emergency response activities. In Proceedings of the 84th AMS Annual Meeting: Symposium on Planning, Nowcasting, and Forecasting in the Urban Zone, Seattle, WA, USA, 10–12 January 2004. https://ams.confex.com/ams/84Annual/techprogram/paper_74017.htm
- Mexis, N., Tsigdinos, S. & Spyropoulou, I. (2025). Evidence-based policy reforms for enhancing active travel in post-pandemic cities. Lessons from Athens, Greece. Urban Transitions, 2, 100009. https://doi.org/10.1016/j.ubtr.2025.100009
- Miletić, R. (2022). Regional specialization in Serbia during the period 2001–2015. Journal of the Geographical Institute “Jovan Cvijić” SASA, 72(1), 67–83. https://doi.org/10.2298/IJGI2201067M
- Mileu, N., & Queirós, M. (2022). Nighttime and daytime population estimation from open data. Geographia Technica, 17, 179–192. https://doi.org/10.21163/gt_2022.172.15
- Miljanović, D., Vuksanović-Macura, Z.,& Doljak, D. (2023). Rethinking the spatial transformation of postsocialist cities: Shrinking, sprawling or densifying. in Cities, 140, 104443. https://doi.org/10.1016/j.cities.2023.104443
- ONS. (2023). Population and migration estimates – exploring alternative definitions: May 2023. Office for National Statistics. https://www.ons.gov.uk/peoplepopulationandcommunity/populationandmigration/populationestimates/articles/populationandmigrationestimatesexploringalternativedefinitions/may2023
- Oh, D., & Park, I.K. (2023). Nocturnal Vs. Diurnal: Relationship between Land Use and Visit Time Patterns in Commercial Areas. Appl. Spatial Analysis 16, 329–352. https://doi.org/10.1007/s12061-022-09480-0
- OpenStreetMap Contributors. (2017). OpenStreetMap. In Planet dump retrieved from https://planet.osm.org . https://www.openstreetmap.org
- Panczak, R., Charles-Edwards, E. & Corcoran, J. (2020). Estimating temporary populations: a systematic review of the empirical literature. Humanit Soc Sci Commun 6, 87. https://doi.org/10.1057/s41599-020-0455-y
- Politis, I., Georgiadis, G., Papadopoulos, E., Fyrogenis, I., Nikolaidou, A., Kopsacheilis, A., Sdoukopoulos, A., & Verani, E. (2021). COVID-19 lockdown measures and travel behavior: The case of Thessaloniki, Greece. Transportation research interdisciplinary perspectives, 10, 100345. https://doi.org/10.1016/j.trip.2021.100345
- Potić, I. (2024). Integrating advanced technologies for enhanced demographic research and urban planning. Stanovništvo, 62(1), 169–173. https://doi.org/10.59954/stnv.628
- Qi, W., Liu, S., Gao, X., & Zhao, M. (2015). Modeling the spatial distribution of urban population during the daytime and at night based on land use: A case study in Beijing, China. Journal of Geographical Sciences, 25, 756–768. https://doi.org/10.1007/s11442-015-1200-0
- Shen, J. (2002). A study of the temporary population in Chinese cities. Habitat International, 26, 363–377. https://doi.org/10.1016/S0197-3975(02)00013-9
- Simić, V., Ivanović, I., Đorić, V., & Torkayesh, A. E. (2022). Adapting Urban Transport Planning to the COVID-19 Pandemic: An Integrated Fermatean Fuzzy Model. Sustainable cities and society, 79, 103669. https://doi.org/10.1016/j.scs.2022.103669
- SORS. (2025). Additionally processed 2022 census data on commuting. Data obtained upon personal request for the purposes of this research. Statistical Office of the Republic of Serbia, Belgrade
- Todorić, J. (2024). Consumers’ mobility in Belgrade: Spatial patterns. Belgrade: Geographical Institute of “Jovan Cvijić” SASA. https://doi.org/10.46793/80029-87-0.JT
- Tomašević, A., & Sokolovska, V. (2017). Commuting network of AP Vojvodina. Kultura Polisa, 14(34), 269–281. Retrieved from https://kpolisa.com/index.php/kp/article/view/755
- Tošić, D. (2018). Principi regionalizacije [Principles of regionalization]. Faculty of Geography, University of Belgrade.
- Vojković, G., Živanović, Z. & Magdalenić, I. (2018). Spatial-demographic misbalances as a challenge to the population policy. Zbornik Matice srpske za drustvene nauke 167, 663–672. https://doi.org/10.2298/ZMSDN1867663V
- Wang, Y., Yue, X., Li, C., Wang, M., Zhang, H., & Su, Y. (2022). Relationship between Urban Three-Dimensional Spatial Structure and Population Distribution: A Case Study of Kunming’s Main Urban District, China. Remote Sensing, 14(15), 3757. https://doi.org/10.3390/rs14153757
- Willecke, M. (2025), Temporariness in the Life Course of Multi-local Residents: Processuality of Home. Population, Space and Place, 31: e70007. https://doi.org/10.1002/psp.70007
- Zakon o teritorijalnoj organizaciji Republike Srbije (129/2007, 18/2016, 47/2018, 9/2020). Službeni glasnik Republike Srbije, No. 129/2007, 18/2016, 47/2018, 9/2020. [Law on the Territorial Organization of the Republic of Serbia, in Serbian]. https://pravno-informacioni-sistem.rs/eli/rep/sgrs/skupstina/zakon/2007/129/1/reg
- Živanović, V., Pavlović, M., Kovjanić, A., Tošić, D., & Krstić, F. (2021). Concept of polycentricity – the differences between development policies and spatial reality. Journal of the Geographical Institute of “Jovan Cvijić” SASA, 71(1), 75–90. https://doi.org/10.2298/IJGI2101075Z
- Živanović, Z., Tošić, B., Nikolić, T., & Gatarić, D. (2019). Urban System in Serbia—The Factor in the Planning of Balanced Regional Development. Sustainability, 11(15), 4168. https://doi.org/10.3390/su11154168
Footnotes
- Since this paper analyses the number of inhabitants during certain periods, as well as the change between them, special terms have been assigned for easier distinction. For the number of inhabitants, the established terms, daytime and nighttime population, have been used, while the term diurnal is used for the change.
- *This type of land use class includes all other land uses with a very small amount of population and share of less than 1% of the total population.
Article Details
Published by the Institute of Social Sciences - Center for Demographic Research


References
Bajat, B., Krunić, N., & Kilibarda, M. (2011) Dasymetric mapping of spatial distribution of population in Timok Region. In: Proceedings of International Scientific Conference Professional Practice and Education in Geodesy And Related Fields, 24th-26th Jun 2011, Kladovo, Serbia. pp 30-34.
Bajat, B., Krunić, N., Kilibarda, M., & Samardžić-Petrović, M. (2011). Spatial prediction of Human Population Change. Paper presented at AGILE International Conference on Geographic Information Science, Utrecht, Netherlands, 18-21 April 2011.
Bajat, B., Krunić, N., Samardžić-Petrović, M., & Kilibarda, M. (2013). Dasymetric modelling of population dynamics in urban areas. Geodetski vestnik, 57(4), 777-792. https://www.geodetski-vestnik.com/arhiv/57/4/gv57-4_bajat.pdf DOI: https://doi.org/10.15292/geodetski-vestnik.2013.04.777-792
Batista e Silva, F. and Poelman, H. (2016) Mapping population density in functional urban areas : a method to downscale population statistics to urban atlas polygons, Publications Office. https://data.europa.eu/doi/10.2791/06831
Bhaduri, B. (2017). Population Distribution During the Day. In: S. Shekhar, H. Xiong, X. Zhou, (Eds) Encyclopedia of GIS. (pp. 1607-1614). Springer, Cham. https://doi.org/10.1007/978-3-319-17885-1_1005 DOI: https://doi.org/10.1007/978-3-319-17885-1_1005
Bian, R., & Wilmot, C. G. (2015). Spatiotemporal Population Distribution Method for Emergency Evacuation: Case Study of New Orleans, Louisiana. Transportation Research Record, 2532(1), 99-106. https://doi.org/10.3141/2532-12 DOI: https://doi.org/10.3141/2532-12
Brollo, B., & Celata, F. (2022). Temporary populations and sociospatial polarisation in the short-term city. Urban Studies, 60(10), 1815-1832. https://doi.org/10.1177/00420980221136957 DOI: https://doi.org/10.1177/00420980221136957
Charles-Edwards, E. (2016). The Estimation of Temporary Populations in Australia. In: Wilson, T., Charles-Edwards, E., Bell, M. (Eds) Demography for Planning and Policy: Australian Case Studies. Applied Demography Series, vol 7. (pp. 31-49). Springer, Cham. https://doi.org/10.1007/978-3-319-22135-9_3 DOI: https://doi.org/10.1007/978-3-319-22135-9_3
Charles-Edwards, E., Bell, M., Panczak, R., & Corcoran, J. (2020). A Framework for Official Temporary Population Statistics. Journal of Official Statistics, 36, 1–24. https://doi.org/10.2478/jos-2020-0001 DOI: https://doi.org/10.2478/jos-2020-0001
Choorat, W., Sawangdee, Y., Punpuing, S., & Piotrowski, M. (2025). Understanding Commuting Mode Choices in Bangkok: The Role of Sociodemographics and Urban Structure in Shaping Transportation Preferences. Journal of Population and Social Studies [JPSS], 34(-), 217–235. retrieved from https://so03.tci-thaijo.org/index.php/jpss/article/view/283131 DOI: https://doi.org/10.25133/JPSSv342026.012
Čaušević, A. (2023). Impact of the COVID-19 Pandemic on Travel Behavior and Travel Mode Preferences: The Example of Bosnia and Herzegovina. Sustainability, 15(13), 10701. https://doi.org/10.3390/su151310701 DOI: https://doi.org/10.3390/su151310701
Duarte, C.M. & Fernández, M.T. (2017). The influence of urban structure on commuting: An analysis for the main metropolitan systems in Spain. Procedia Engineering, 198, 52–68. https://doi.org/10.1016/j.proeng.2017.07.073 DOI: https://doi.org/10.1016/j.proeng.2017.07.073
EEA. (2015). Urban Atlas Land Cover/Land Use 2006 (vector), Europe, 6-yearly, Jul. 2015. European Environment Agency. https://doi.org/10.2909/551D6741-84D0-43FB-BDA8-1768D51BBB4C
EEA. (2016a). Urban Atlas Land Cover/Land Use 2012 (vector), Europe, 6-yearly, Jan. 2021. European Environment Agency. https://doi.org/10.2909/DEBC1869-A4A2-4611-AE95-DAEEFCE23490
EEA. (2016b) Mapping guide for a European Urban Atlas, v6.3. European Environment Agency, Copenhagen. https://land.copernicus.eu/en/technical-library/urban_atlas_2012_2018_mapping_guide/@@download/file
EEA. (2020). Urban Atlas Land Cover/Land Use 2018 (vector), Europe, 6-yearly, Jul. 2021. European Environment Agency. https://doi.org/10.2909/FB4DFFA1-6CEB-4CC0-8372-1ED354C285E6
Esri Inc. (n.d.). ArcGIS Pro (Version 3.1.1). In Esri Inc.
Esri Data Development. (2025). Use and interpret daytime population data: Population expansions and contractions between day and night and how it impacts the daytime workforce [ArcGIS StoryMap]. ArcGIS. https://storymaps.arcgis.com/stories/8edbce2cb5584be3b3406432c17cf5f7
Ferent, A. (2023). Airplane parts and Covid masks: labour commuters of North-western Romania between Central and Eastern European “re-industrialisation” and the global market. Studia Universitatis Babeș-Bolyai Sociologia, 68(1), 107-127. https://doi.org/10.2478/subbs-2023-0010 DOI: https://doi.org/10.2478/subbs-2023-0010
Filipović, M. (2020). Dnevni migracioni sistem Beograda [Daily migration system of Belgrade; Unpublished doctoral dissertation]. Faculty of Geography, University of Belgrade. https://nardus.mpn.gov.rs/handle/123456789/18274
Filipović, M., Krunić, N., & Zhelenkova, E. (2022). Functional dependence of settlements and its demographic component in the transition phase of the daily urban system. Journal of the Geographical Institute Jovan Cvijic, SASA, 72(3), 323–339. https://doi.org/10.2298/IJGI2203323F DOI: https://doi.org/10.2298/IJGI2203323F
Freire, S. M. C. (2007). Modeling daytime and nighttime population distributions in Portugal using geographic information systems Doctoral dissertation, University of Kansas. https://hdl.handle.net/1808/3978
Gajić, A., & Krunić, N. (2020). Primena podataka „Urban Atlas” u istraživanju i planiranju prostora: primer Beograda. In J. Petrić & M. Vujošević (Eds.), Teorijska, razvojna i primenjena istraživanja prostornih procesa za obnovu strateškog mišljenja i upravljanja u Srbiji (pp. 67-85). Beograd : Institut za arhitekturu i urbanizam Srbije. https://hdl.handle.net/21.15107/rcub_raumplan_829
Gajić Protić, А., Krunić, N., & Srnić, D. (2024) Perspectives for the development of Urban Areas in the Republic of North Macedonia. Proceedings book 2024, 6th Congress of Macedonian geographers with international participation, 29-30 May 2024., Ohrid, N. Macedonia. https://doi.org/10.37658/mgd24119gp DOI: https://doi.org/10.37658/MGD24119gp
Giovenco, T. (2024). What is the difference between employees and daytime population from Experian CAPE. Alteryx Knowledge Base. Retrieved August 3, 2025, from https://knowledge.alteryx.com/index/s/article/What-is-the-difference-between-employees-and-daytime-population-from-Experian-CAPE-1583459125878
Glavić, D., Trpković, A., Milenković, M., & Jevremović, S. (2023). Pandemic impact on traffic trends and patterns in the city of Belgrade. Transport, 38(3), 165–177. https://doi.org/10.3846/transport.2023.19375 DOI: https://doi.org/10.3846/transport.2023.19375
Google. (2020). Google Earth Pro 7.3.3.7786. In Geospatial Solutions [Computer software]. earth.google.com/web
Gorný, D. (2025). At the intersection: the impact of work and university schedules on daily mobility of working students. Mobilities, 1–18. https://doi.org/10.1080/17450101.2025.2532398 DOI: https://doi.org/10.1080/17450101.2025.2532398
Guest, A.M. (1976). Nighttime and Daytime Populations of Large American Suburbs. Urban Affairs Review, 12, 57–82. https://doi.org/10.1177/107808747601200104 DOI: https://doi.org/10.1177/107808747601200104
Güller, C., & Varol, C. (2024). Unveiling the daily rhythm of urban space: Exploring the influence of built environment on spatiotemporal mobility patterns. Applied Geography, 170, Article 103366. https://doi.org/10.1016/j.apgeog.2024.103366 DOI: https://doi.org/10.1016/j.apgeog.2024.103366
Ilić, Ј. (1970). Karakteristike funkcionalnih odnosa između grada i okoline sa posebnim osvrtom na SR Srbiju. Stanovništvo, 3–4, 167–189.
ISTAT. (2020). Daytime population for study and work: Year 2016. Istituto Nazionale di Statistica (ISTAT). Retrieved August 3, 2025, from https://www.istat.it/wp-content/uploads/2020/11/Daytime-population-2016.pdf
Jo, A., Lee, S.-K., & Kim, J. (2020). Gender Gaps in the Use of Urban Space in Seoul: Analyzing Spatial Patterns of Temporary Populations Using Mobile Phone Data. Sustainability, 12(16), 6481. https://doi.org/10.3390/su12166481 DOI: https://doi.org/10.3390/su12166481
Jolley, J., Lane, B. & Brun, L. (2011) Economic Development Planning In Bedroom Communities: A Case Study of Chatham County, North Carolina. Journal of Rural and Community Development 6, 1. 113–128. https://journals.brandonu.ca/jrcd/article/view/444/107
Kokotović Kanazir, V., Panić, M. ., & Drobnjaković, M. (2024). Value of people - human capital in Serbia through the prism of educational attainment of young population. Stanovnistvo, 62(S1), S105–S129. https://doi.org/10.59954/stnv.625 DOI: https://doi.org/10.59954/stnv.625
Krunić, N., Bajat, B., Kilibarda, M., & Tošić, D. (2011). Modelling the spatial distribution of Vojvodina’s population by using dasymetric method. Spatium, 24, 45-50. https://doi.org/10.2298/SPAT1124045K DOI: https://doi.org/10.2298/SPAT1124045K
Krunić, N. (2012). Prostorno funkcijski odnosi i veze u mreži naselja Vojvodine [Spatial-functional relations and links in the network of settlements of Vojvodina, Unpublished doctoral dissertation]. Faculty of Geography, University of Belgrade.
Krunić, N., Bajat, B., & Kilibarda, M. (2015). Dasymetric Mapping of Population Distribution in Serbia Based on Soil Sealing Degrees Layer. In: K. Ružičková, & T. Inspektor, (Eds.) Surface Models for Geosciences. Lecture Notes in Geoinformation and Cartography (pp 137-149) Springer, Cham. https://doi.org/10.1007/978-3-319-18407-4_12 DOI: https://doi.org/10.1007/978-3-319-18407-4_12
Krunić, N., Milijić, S., Đurđević, J., Bakić, O., & Krstić, V. (2015). Dasymetric mapping of flood impact to the population in Serbia. Paper presented at 9th World Congress of EWRA Water Resources Management in a Changing World: Challenges and Opportunities”, Istanbul, Turkey.
Kobayashi, T., Medina, R.M., & Cova, T.J. (2011). Visualizing Diurnal Population Change in Urban Areas for Emergency Management. The Professional Geographer, 63(1), 113–130. https://doi.org/10.1080/00330124.2010.533565 DOI: https://doi.org/10.1080/00330124.2010.533565
KNGII. (2021). The National Atlas of Korea (Vol. III). Korean National Geographic Information Institute, Ministry of Land, Infrastructure and Transport. http://nationalatlas.ngii.go.kr/pages/page_2563.php?
Kuffer, M., & Sliuzas, R.V. (2014). Modelling day and night time population using a 3D urban model. Proceedings Real Corp 2014 : 21-23 May 2014, Vienna, Austria. pp. 397-405. http://www.corp.at/archive/CORP2014_46.pdf
Lukić V. (2011a). Demografski razvitak i funkcionalna struktura Pančeva. Geografski institut “Jovan Cvijić” SANU, Beograd
Lukić V. (2011b). Commuting in the settlement system of Serbia. Stanovništvo 49(2):25–50. https://doi.org/10.2298/STNV1102025L DOI: https://doi.org/10.2298/STNV1102025L
Lukić, V. (2022). Migration and Mobility Patterns in Serbia. In: Manić, E., Nikitović, V., Djurović, P. (eds) The Geography of Serbia: Nature, People, Economy(157-167). World Regional Geography Book Series. Springer, Cham. https://doi.org/10.1007/978-3-030-74701-5_12 DOI: https://doi.org/10.1007/978-3-030-74701-5_12
Ma, Y., Xu, W., Zhao, X., & Li, Y. (2017). Modeling the Hourly Distribution of Population at a High Spatiotemporal Resolution Using Subway Smart Card Data: A Case Study in the Central Area of Beijing. ISPRS International Journal of Geo-Information, 6(5), 128. https://doi.org/10.3390/ijgi6050128 DOI: https://doi.org/10.3390/ijgi6050128
Matijević, D. (2009). Prostorno-funkcionalna povezanost naselja opštine Stara Pazova sa urbanim sistemom Beograda (Posebna izdanja 73) [Spatial-functional connection settlements of the municipality of Stara Pazova and Belgrade urban system (Special issue 73)]. Geographical Institute “Jovan Cvijić” SASA.
McPherson, T.N. & Brown, M.J. (2004). Estimating daytime and nighttime population distributions in U.S. cities for emergency response activities. In Proceedings of the 84th AMS Annual Meeting: Symposium on Planning, Nowcasting, and Forecasting in the Urban Zone , Seattle, WA, USA, 10–12 January 2004. https://ams.confex.com/ams/84Annual/techprogram/paper_74017.htm
Mexis, N., Tsigdinos, S. & Spyropoulou, I. (2025). Evidence-based policy reforms for enhancing active travel in post-pandemic cities. Lessons from Athens, Greece. Urban Transitions, 2, 100009. https://doi.org/10.1016/j.ubtr.2025.100009 DOI: https://doi.org/10.1016/j.ubtr.2025.100009
Miletić, R. (2022). Regional specialization in Serbia during the period 2001-2015. Journal of the Geographical Institute “Jovan Cvijić” SASA, 72(1), 67-83. https://doi.org/10.2298/IJGI2201067M DOI: https://doi.org/10.2298/IJGI2201067M
Mileu, N., & Queirós, M. (2022). Nighttime and daytime population estimation from open data. Geographia Technica, 17, 179 -192. https://doi.org/10.21163/gt_2022.172.15 DOI: https://doi.org/10.21163/GT_2022.172.15
Miljanović, D., Vuksanović-Macura, Z.,& Doljak, D. (2023). Rethinking the spatial transformation of postsocialist cities: Shrinking, sprawling or densifying. in Cities, 140, 104443. https://doi.org/10.1016/j.cities.2023.104443 DOI: https://doi.org/10.1016/j.cities.2023.104443
ONS. (2023). Population and migration estimates - exploring alternative definitions: May 2023. Office for National Statistics. https://www.ons.gov.uk/peoplepopulationandcommunity/populationandmigration/populationestimates/articles/populationandmigrationestimatesexploringalternativedefinitions/may2023
Oh, D., & Park, I.K. (2023). Nocturnal Vs. Diurnal: Relationship between Land Use and Visit Time Patterns in Commercial Areas. Appl. Spatial Analysis 16, 329–352 https://doi.org/10.1007/s12061-022-09480-0 DOI: https://doi.org/10.1007/s12061-022-09480-0
OpenStreetMap Contributors. (2017). OpenStreetMap. In Planet dump retrieved from https://planet.osm.org. https://www.openstreetmap.org
Panczak, R., Charles-Edwards, E. & Corcoran, J. (2020). Estimating temporary populations: a systematic review of the empirical literature. Humanit Soc Sci Commun 6, 87 https://doi.org/10.1057/s41599-020-0455-y DOI: https://doi.org/10.1057/s41599-020-0455-y
Politis, I., Georgiadis, G., Papadopoulos, E., Fyrogenis, I., Nikolaidou, A., Kopsacheilis, A., Sdoukopoulos, A., & Verani, E. (2021). COVID-19 lockdown measures and travel behavior: The case of Thessaloniki, Greece. Transportation research interdisciplinary perspectives, 10, 100345. https://doi.org/10.1016/j.trip.2021.100345 DOI: https://doi.org/10.1016/j.trip.2021.100345
Potić, I. (2024). Integrating advanced technologies for enhanced demographic research and urban planning. Stanovništvo, 62(1), 169–173. https://doi.org/10.59954/stnv.628 DOI: https://doi.org/10.59954/stnv.628
Qi, W., Liu, S., Gao, X., & Zhao, M. (2015). Modeling the spatial distribution of urban population during the daytime and at night based on land use: A case study in Beijing, China. Journal of Geographical Sciences, 25, 756-768. https://doi.org/10.1007/s11442-015-1200-0 DOI: https://doi.org/10.1007/s11442-015-1200-0
Shen, J. (2002). A study of the temporary population in Chinese cities. Habitat International, 26, 363–377. https://doi.org/10.1016/S0197-3975(02)00013-9 DOI: https://doi.org/10.1016/S0197-3975(02)00013-9
Simić, V., Ivanović, I., Đorić, V., & Torkayesh, A. E. (2022). Adapting Urban Transport Planning to the COVID-19 Pandemic: An Integrated Fermatean Fuzzy Model. Sustainable cities and society, 79, 103669. https://doi.org/10.1016/j.scs.2022.103669 DOI: https://doi.org/10.1016/j.scs.2022.103669
SORS. (2025). Additionally processed 2022 census data on commuting. Data obtained upon personal request for the purposes of this research. Statistical Office of the Republic of Serbia, Belgrade
Todorić, J. (2024). Consumers’ mobility in Belgrade: Spatial patterns. Belgrade: Geographical Institute of "Jovan Cvijić" SASA. https://doi.org/10.46793/80029-87-0.JT DOI: https://doi.org/10.46793/80029-87-0.JT
Tomašević , A., & Sokolovska, V. (2017). Commuting network of AP Vojvodina. Kultura Polisa, 14(34), 269–281. Retrieved from https://kpolisa.com/index.php/kp/article/view/755
Tošić, D. (2018). Principi regionalizacije [Principles of regionalization]. Faculty of Geography, University of Belgrade.
Vojković, G., Živanović, Z. & Magdalenić, I. (2018). Spatial-demographic misbalances as a challenge to the population policy. Zbornik Matice srpske za drustvene nauke 167, 663–672. https://doi.org/10.2298/ZMSDN1867663V DOI: https://doi.org/10.2298/ZMSDN1867663V
Wang, Y., Yue, X., Li, C., Wang, M., Zhang, H., & Su, Y. (2022). Relationship between Urban Three-Dimensional Spatial Structure and Population Distribution: A Case Study of Kunming’s Main Urban District, China. Remote Sensing, 14(15), 3757. https://doi.org/10.3390/rs14153757 DOI: https://doi.org/10.3390/rs14153757
Willecke, M. (2025), Temporariness in the Life Course of Multi-local Residents: Processuality of Home. Population, Space and Place, 31: e70007. https://doi.org/10.1002/psp.70007 DOI: https://doi.org/10.1002/psp.70007
Zakon o teritorijalnoj organizaciji Republike Srbije (129/2007, 18/2016, 47/2018, 9/2020). Službeni glasnik Republike Srbije, No. 129/2007, 18/2016, 47/2018, 9/2020. [Law on the Territorial Organization of the Republic of Serbia, in Serbian]. https://pravno-informacioni-sistem.rs/eli/rep/sgrs/skupstina/zakon/2007/129/1/reg
Živanović, V., Pavlović, M., Kovjanić, A., Tošić, D., & Krstić, F. (2021). Concept of polycentricity - the differences between development policies and spatial reality. Journal of the Geographical Institute of "Jovan Cvijić" SASA, 71(1), 75-90. https://doi.org/10.2298/IJGI2101075Z DOI: https://doi.org/10.2298/IJGI2101075Z
Živanović, Z., Tošić, B., Nikolić, T., & Gatarić, D. (2019). Urban System in Serbia—The Factor in the Planning of Balanced Regional Development. Sustainability, 11(15), 4168. https://doi.org/10.3390/su11154168 DOI: https://doi.org/10.3390/su11154168