
Do Drought and Agricultural Factors Influence Migration in Serbia? Insights from a Segmentation Study
Article Sidebar
Main Article Content
Abstract
The main aim of this paper is to conduct an intraregional analysis in Serbia and to examine how districts (NUTS 3) can be grouped based on drought and agricultural vulnerability, with the supplementary aim of analysing how these district segments differ in their internal emigration rates. Segmentation analysis was conducted for three reference years (2002, 2011, and 2022) using an advanced biclustering approach. The results indicate overall changes in drought, agricultural, and population migration variables across the periods, although substantial cross-district heterogeneity remains. The analysis clearly shows that, at the district level, drought parameters increased over the 20-year period. Another aspect that attracts attention is the temporal evolution of the variation among districts. For some variables, the variation is stable during the observation period (Share of permanent forest, grassland and other natural or semi-natural areas in agricultural land use, Share of agricultural land in use, and Emigration rate). This indicates that even if the mean values changed over time, all districts experienced the same magnitude of change. On the other hand, the variation of Share of Agricultural Population between districts is decreasing, indicating convergence over time. Across the observed periods, five distinct segments were consistently identified, revealing both stable and evolving district- and region-specific patterns. No statistically significant difference in the Emigration rate was found between the defined segments across the observed periods. By uncovering both the shared trajectories and divergent developments, the study contributes to a deeper understanding of population migration dynamics under drought and environmental challenges and enables the identification of districts and district segments threatened by these challenges. The insights from this study identify the segments (groups) of districts where emigration is more pronounced and could serve as a signal to policymakers. We believe that the presented intraregional study could act as an impetus for further detailed analysis on the nexus between environmental challenges and population dynamics in Serbia.
1 INTRODUCTION
The interaction between population and the environment has traditionally been studied, primarily through the impact of population dynamics on the environment, rather than the reverse. However, as climate change intensifies, the influence of the environment on population dynamics has attracted increasing research attention. De Sherbinin et al. (2007) in their study on the relationship between population and the environment provide a historical overview of the extensive literature on the topic. According to their research, some of the earliest studies on the topic date back to 1798 and the work of Thomas Malthus, “Essay on the Principle of Population”. Since then, almost two and a half centuries have passed, and the researchers are still striving to understand this relationship better (Bretschger & Xepapadeas, 2025).
Recent research has analysed the relation between environmental challenges and population dynamics in various ways. For example, Marinković and Potić (2025) explored how cold spells impact mortality, Arsenović (2018) researched seasonal variations in mortality due to seasonal changes in average air temperature among the urban population, Molla (2025) focused on how high temperatures impact fertility, García-León et al. (2024) analysed temperature-related mortality in European regions, while Osland et al. (2022) observed migration and transformation of coastal wetlands in response to rising seas. The relationships between environmental challenges and various aspects of population dynamics have been investigated. In this study, we examine the relationship between environmental challenges and internal emigration rates.
The interest and importance of the research on climate change, climate conditions and migration can additionally be confirmed by the newly coined term of “climigration” (Matthews & Potts, 2018). A substantial body of literature has examined the environmental drivers of migration. A comprehensive review by Piguet et al. (2018) identified five main categories of climatic hazards: droughts, floods, hurricanes, sea-level rise, and changes in rainfall patterns. Ghosh and Orchiston (2022) identified nineteen climate-related migration drivers, consolidated into eight categories. To disentangle the relationship, different methodological approaches have been taken, such as panel data analysis (Pradhan & Narayanan, 2020), multi-level modelling (Henry et al., 2004), as well as structural equation modelling (De Longueville et al., 2019).
The spatial scope of this study involves the Republic of Serbia, where significant and persistent regional disparities have long been observed and are closely intertwined with the internal migration dynamics (Jovanović et al., 2023; Molnar & Jandrić, 2019). At the same time, it is reported that Serbia is strongly affected by rising temperatures and climate change (Stojanović et al., 2021; Vuković et al., 2018; Vuković-Vimić & Vujadinović-Mandić, 2024). It was found that in Serbia, climate change is associated with fertility variations (Mirić, 2026), as well as migration (Gligorijević & Bakić, 2025), mortality (Marinković & Potić, 2025), and consequences for the ageing population (Stojilković Gnjatović et al., 2025).
In the present study, we examine the relationship between environmental challenges and agricultural features on one side, and population dynamics on the other, using an intraregional longitudinal segmentation analysis at the NUTS 3 district level in Serbia. The research questions of this study are:
RQ1: How and whether did the environmental and agricultural features in Serbia at the district level change between 2002 and 2022?
RQ2: How can districts be segmented based on the measured drought vulnerability (observed per year and through time)?
RQ3: Are there statistically significant differences between the defined segments when it comes to internal emigration?
To incorporate a temporal dimension, Serbian districts are observed at three distinct points in time: 2002, 2011, and 2022, using official statistics, environmental data and internal emigration rates. The study adopts a segmentation approach based on five variables that indicate climate and agricultural vulnerability, enabling comparisons across multiple periods. This design allows the identification of persistent patterns and changes in district groupings over time, thereby highlighting both similarities and divergences in drought conditions across districts. Moreover, the analysis facilitates the identification of the districts that have been most affected by drought and climate change over the past decades.
2 LITERATURE REVIEW
The first direction of the literature review was the exploration of district and regional differences at the national level. Herein, we outline several recent studies that are longitudinal, based on segmentation, or both, and were conducted in Serbia.
Drobnjaković et al. (2016) state that exploration of regional and intraregional inequalities is a multidimensional problem and provide an extensive literature review on different indicators which have been used for this purpose. They observe three groups of indicators: demographic, socio-economic, and settlement-related. Based on the statistical analysis, the authors opt for hierarchical clustering using Euclidean distance and Ward’s method. Their analysis yields five segments of municipalities, each with its own strengths and weaknesses.
Joksimović and Golić (2017) conducted a regional (NUTS 2) and intraregional (NUTS 3) study in Serbia. Their study is longitudinal, covering the period 1991–2015. Indicators of population dynamics, as well as economic development, are observed. This descriptive study contributes to a better understanding of the differences and inequalities among districts of Serbia based on demographic, social and economic indicators. The authors conclude that Serbia is polarised in the distribution of districts and regions by socioeconomic development.
Živanović and Gatarić (2017) observed differences in regional development on the territory of the Republic of Serbia. In their research, they examined population density, employment, unemployment, the structure of economic activity, and average salary using official data from the Statistical Office of the Republic of Serbia. Their study, mostly descriptive, highlighted the striking unevenness of regional development in Serbia.
In a more recent study, Stamenković et al. (2021) proposed a methodological framework for classifying districts in Serbia based on the level of economic development. In their multivariate analysis, they applied hierarchical agglomerative clustering. According to the results, three distinct segments were identified, based on five variables. An addition to the research framework was the application of the Multivariate Analysis of Variance (MANOVA) to validate the created classification. The results showed that, based on 2013 data, there were pronounced regional economic asymmetries among NUTS 3 territorial units in Serbia.
The outlined segmentation studies show the following. First, there is a clear research interest in segmentation studies at the NUTS 3 level in Serbia. In terms of methodological approach, the studies are either descriptive or use a clustering algorithm. Finally, the data on which the studies are conceptualised are related to socio-economic indicators and indicators of population dynamics. The reviewed studies consistently identify Belgrade and the northern regions, particularly Vojvodina, as the most economically developed, while Southern and Eastern Serbia remain significantly less developed. This spatial pattern reflects a persistent concentration of economic activity and resources in the north, contrasted with structural disadvantages in peripheral districts.
As a country, Serbia is evidently facing environmental challenges. According to a 2017 report, total material damage from extreme climatic and weather conditions since 2000 has exceeded €5 billion, with more than 70% of the losses attributed to droughts and high temperatures, with warming and precipitation shortages as the main climate stressors. Floods constitute the second most significant source of economic losses (Ministarstvo poljoprivrede i zaštite životne sredine, 2017). Bearing in mind the rising level of environmental challenges, the Law on Disaster Risk Reduction and Emergency Management (Zakon o smanjenju rizika od katastrofa i upravljanju vanrednim situacijama, 2018) was adopted in 2018, and, concurrently, the Disaster Risk Register (Ministry of Interior of the Republic of Serbia, 2025) was established. The report within the POPENVIROS project closely analysed the indicators of climate change in Serbia in the period 1980–2020 and showed visible changes (Dragićević et al., 2025).
Another aspect of environmental challenges’ impact which should be considered is agriculture. Agricultural practices can lead to environmental challenges such as natural resource degradation, a decline in soil fertility, and reduced environmental resilience (Singh et al., 2019). Linkages between agricultural practices and human migration have been found, however, with highly context-dependent results, as empirical studies demonstrate that agricultural land may both encourage and discourage migration, contingent on local economic and demographic conditions (Zhang et al., 2025). There are studies on this relationship in Serbia as well. Spalević (2009) pointed out that the rural space in Serbia was characterised by depopulation, additionally increased by the transfer of the working population from agricultural to non-agricultural activities. Todorović et al. (2010) noted rapid abandonment of agriculture and a visible process of deagrarisation, along with continuing depopulation and demographic erosion, especially in rural Serbia. In a more recent study, Malinić et al. (2025) showed that rural border areas of Serbia underwent pronounced demographic change between 2002 and 2022, marked by persistent population decline, population ageing, and a growing share of single-person households, which directly reduced the availability of labour and the viability of small-scale farming. These demographic pressures contributed to significant land-use transformations, with agricultural land increasingly being abandoned and replaced by forested and grassland areas, particularly in hilly and mountainous terrain. Most results show a decrease in agricultural activity driven by demographic factors and the low competitiveness of individual farming in Serbia.
According to the Statistical Office of the Republic of Serbia (2025), Serbia’s population at the end of 2024 was 6,567,783 inhabitants, with a negative annual population growth rate of −5.7 per 1,000 inhabitants. Long-term demographic trends in Serbia have been shaped by persistently low fertility, pronounced population ageing, and sustained out-migration, resulting in continuous population decline over several decades (Vojković & Gligorijević, 2022; Nikitović, 2025). Emigration from Serbia has unfolded through multiple historical phases, each marked by distinct intensities and destination patterns (Vuković, 2005), while more recent evidence points to pronounced spatial disparities in emigration across municipalities, districts, and major macro-regions such as Central Serbia and Vojvodina, underscoring the strong territorial heterogeneity of migration dynamics (Predojević-Despić & Penev, 2016).
3 RESEARCH METHODOLOGY
Based on the research objectives and questions, the following research outline is proposed (Figure 1).
Figure 1. Research outline
Five environmental variables were considered. The first three are: Share of agricultural population (AgriPop), Share of agricultural land in use (AgriLand), and Share of permanent forest, grassland and other natural or semi-natural areas in agricultural land use (PFGO). We also considered the Average number of tropical days (Tropical), defined as a day with the temperature above 25°C according to the Expert Team on Climate Change Detection and Indices (ETCCDI) (Project team ECA&D, 2013). Finally, the widely acknowledged Standardised Precipitation and Evapotranspiration Index (SPEI) was observed as a measurement of drought. The SPEI was also used in a previous study on drought in Serbia (Bezdan et al., 2019; Djurdjević et al., 2024; Filipović et al., 2025; B. Stosic et al., 2024; T. Stosic et al., 2024). We use these five variables to define segments of districts with similar characteristics in terms of agriculture, warming, and drought, wanting to identify whether differences in these characteristics also produce differences in internal migration (Internal emigration rate).
In total, 25 districts (NUTS 3) were observed, covering the entire national territory except the Autonomous Province of Kosovo and Metohija. This region and its districts are excluded from the analysis due to the unavailability of the official statistical data. The data were obtained from the Digital Climate Atlas of Serbia (Ministry of Environmental Protection, 2022) and from documents published by the Statistical Office of the Republic of Serbia.
It should be noted that the NUTS 3 district level, while widely used in regional analyses in Serbia, as presented in the literature review, represents a relatively coarse spatial unit that may mask important internal heterogeneity. Serbian districts often encompass diverse landscapes and settlement types within their boundaries. For instance, the Belgrade district combines a dense urban core with peri-urban and agricultural zones. In contrast, Vojvodina districts typically contain both intensive agricultural land and mid-sized urban centres with distinct demographic profiles. Aggregating environmental and demographic data to this level risks averaging out precisely the local-level variation that is most relevant for understanding how drought and agricultural conditions relate to migration decisions. Municipality-level analysis would offer greater spatial precision and better capture the micro-regional contrasts. However, the choice of NUTS 3 was guided by data availability and comparability with previous segmentation studies in Serbia, and the results should be interpreted with this spatial constraint in mind.
As the study observed several time points, the first step was to define the specific time points and periods for analysis. While the analysis could have been conducted for each available year, we chose to focus on three specific time points – the census years for two reasons. First, the previous research on environmental monitoring has highlighted that, although longer periods (e.g., 30 years) are recommended for defining climatic normals, a 10-year interval is frequently used as a practical threshold to investigate long-term environmental changes and reduce the influence of short-term variability (Lindenmayer et al., 2012). Second, the data collected in census years are more reliable and trustworthy for demographic variables. Therefore, the observed time points were 2002, 2011, and 2022, i.e., the time periods 2002–2011 and 2011–2022.
The next step was to choose the segmentation approach. On one hand, segmenting districts solely based on five environmental variables could be a task more suited for clustering than biclustering, especially considering that there are only 25 districts (NUTS 3-level) (Eurostat, 2025). As an output, we would obtain information on all variable values per segment, but without insight into which specific variables led to the segment formation. On the other hand, biclustering algorithms drew our attention. Biclustering is an advanced segmentation technique that simultaneously groups rows and columns of a data matrix, enabling the identification of local patterns that would remain hidden using traditional clustering approaches (Kaiser, 2011). Unlike standard clustering methods, which assign observations to segments based on all variables simultaneously, biclustering selects a subset of variables for each segment, thereby revealing which features are most informative in defining each group (Pontes et al., 2015). This method is particularly suitable for complex, multidimensional data where relationships between subsets of observations and variables are of analytical interest. We believed that, even with a low-complexity dataset, creating biclusters based on five indicators would reveal nuances among the districts and indicate which environmental challenge variables are more informative in each segment, a distinction that conventional clustering would not provide.
Finally, a decision was made regarding the biclustering algorithm. Given the large number of available algorithms, the continuous nature of the collected data, and the sample size, we selected the algorithm proposed by Cheng and Church (2000), known as the delta biclustering, or shortened BCCC, algorithm. This algorithm focuses on the coherence constraint that limits the maximum allowable deviation of values within a bicluster, ensuring internal consistency across the selected rows and columns (Jeremić et al., 2025). By controlling within-bicluster variability, the delta parameter helps balance pattern strictness and interpretability in biclustering results (Cheng & Church, 2000). The analysis was done in R using the “biclust” package (Leisch & De Troyer, 2020).
After the segmentation and inspection of the retained segments and district membership dynamics, the retained segments were compared on the Internal emigration rate, using analysis of variance (ANOVA). Additionally, to inspect the statistical significance of the change in the indicator data between time points, we used a paired-samples t-test.
4 RESULTS
4.1 Descriptive statistics
Before conducting the segmentation analysis, we present the overall data collected by variable and year, analyse the descriptive statistics, and explore whether there have been statistically significant changes in variable values between the observed time periods (Table 1). The variable Share of agricultural population (AgriPop) shows a visible decreasing trend from 2002 to 2022. In absolute values, SPEI, which has increased over the 20-year period, indicates growing drought stress. On the other hand, Average number of tropical days shows a stable upward trend. The remaining three variables show no visible trend. Additionally, we conducted pairwise comparisons between the observed periods. The comparison for 2002–2011 showed a statistically significant difference across all environmental variables (p<0.001), except for AgriLand. The comparison for 2011–2022 showed a statistically significant difference across all environmental variables (p<0.001), except for SPEI. Finally, the comparison between 2002 and 2022 has been conducted. The value of AgriPop has decreased, as well as the value of AgriLand. PFGO has increased, as well as SPEI and Average number of tropical days. Statistically significant differences were detected for all five environmental variables.
| AgriPop | AgriLand | PFGO | Tropical | SPEI | Emigration rate | |
|---|---|---|---|---|---|---|
| 2002 | 25.55±9.12 | 65.77±13.04 | 69.33±21.24 | 22.97±10.55 | -0.58±0.823 | 14.06±3.57 |
| 2011 | 18.41±8.76 | 67.14±13.07 | 68.38±22.10 | 38.06±9.47 | -1.82±0.375 | 14.41±3.15 |
| 2022 | 6.52±3.09 | 56.07±13.10 | 73.04±21.19 | 44.26±15.49 | -1.96±0.546 | 19.94±3.91 |
| 2002–2011 | t=7.13** | t=-1.26 | t=2.62* | t=-14.10** | t=7.32** | t=-0.75 |
| 2011–2022 | t=8.47** | t=13.32** | t=-10.13** | t=-4.07** | t=1.06 | t=-9.93** |
| 2002–2022 | t=13.26** | t=7.63** | t=-6.77** | t=-19.11** | t=14.95** | t=-8.92* |
|
Source: Authors’ calculations
Note: *p<0.05; **p<0.001 |
||||||
Looking at the Emigration rate, there is no statistically significant difference between 2002 and 2011, but this changed between 2011 and 2022. However, it should be noted that between 2002 and 2011, the Emigration rate was stable, and it rose again in 2022, well above the 2002 rate.
To complement the descriptive analysis and examine the direct relationship between environmental and agricultural variables and internal emigration, a pooled ordinary least squares (OLS) regression was estimated. The dataset was structured by stacking district-level observations across the three census years (2002, 2011, and 2022), yielding a total of 75 observations (25 districts × 3 time points). The dependent variable was the internal emigration rate, and the independent variables were the five environmental and agricultural indicators (AgriPop, AgriLand, PFGO, Tropical, and SPEI), along with two dummy variables controlling for the time period (D_2011 and D_2022, with 2002 as the reference category). The results are outlined in Table 2.
| Predictor | Coefficient | t | P value | Adj R2 |
|---|---|---|---|---|
| (Constant) | 24.711 | 9.630 | p<0.001 | 0.527 |
| AgriPop | -0.080 | -1.595 | 0.115 | |
| AgriLand | -0.199 | -4.085 | p<0.001 | |
| PFGO | 0.043 | 0.991 | 0.325 | |
| Tropical | 0.042 | 0.563 | 0.576 | |
| SPEI | -1.002 | -1.133 | 0.261 | |
| D_2011 | -1.796 | -1.194 | 0.237 | |
| D_2022 | -0.027 | -0.014 | 0.989 | |
| Source: Authors’ calculations | ||||
The results indicate that only the share of agricultural land in use (AgriLand) is a statistically significant predictor of internal Emigration rate (B=−0.199, p<0.001). Districts with a higher share of agricultural land tend to exhibit lower Emigration rates. The remaining environmental variables, Share of agricultural population, PFGO, Average number of tropical days, and SPEI, did not reach statistical significance. Notably, neither year dummy was significant, suggesting that, once the environmental and agricultural variables are accounted for, the residual time effect on emigration is negligible. This finding indicates that the observed temporal increase in Emigration rates is at least partially absorbed by the changing environmental and agricultural conditions captured in the model. The overall model is statistically significant (F=10.648, p<0.001) and has an adjusted R square of 52.7%.
Taken together, the pooled regression reinforces the interpretation that, at the NUTS 3 level, drought indicators (Tropical, SPEI) are not direct predictors of internal emigration, while agricultural land use appears to play a more prominent role, likely reflecting broader processes of deagrarisation and rural depopulation documented in the literature (Todorović et al., 2010; Spalević, 2009). These results are to additionally be explored through the segmentation analysis.
4.2 Segmentation Results 2002
The BCCC algorithm was applied to the curated dataset for the year 2002. The resulting segmentation metrics indicated a satisfactory fit, allowing us to proceed with the analysis and interpretation of the segments. Of the 25 observed districts of Serbia, 22 were successfully assigned to segments, while Kolubarski, Šumadijski, and Borski districts remained unsegmented. As much as 88% of the sample has been segmented, which can be regarded as favourable (de Smet, 2019). Table 3 presents the statistics for the district segments obtained through biclustering for 2002. Bicluster 1 is the largest bicluster by dimensions, encompassing seven districts. The seven districts are in southern and eastern Serbia. Bicluster 2 is the second-largest segment, encompassing the three Banat districts and the Podunavski district. Similarly, Bicluster 5 encompasses the three districts of Bačka. Bicluster 3 presents a mixture of western and southern districts. At the same time, Bicluster 4 combines two districts from the Vojvodina region (Sremski and Mačvanski districts), the Belgrade capital and one central region (Pomoravski district). Within Table 3, we also present the results of the comparison of the district segments regarding the Emigration rate. The results indicate that there is no statistically significant difference among the segments in 2002 emigration rates (ANOVA: F=1.427, p>0.05). As the effects of drought on the emigration rate can appear with a time lag, the differences between segments created for the 2002 data have been calculated for the 2002–2011 emigration rate. No statistical differences were found; all additionally conducted ANOVAs showed p>0.05.
| Bicluster | Environmental variables defining the segment | Districts | Mean Emigration rate | ANOVA |
|---|---|---|---|---|
| B1 | AgriLand2002, Tropical2002, SPEI2002 | Moravički district, Rasinski district, Braničevski district, Zaječarski district, Jablanički district, Nišavski district, Toplički district | 14.286 | 1.427 (p>0.05) |
| B2 | AgriPop2002, AgriLand2002, Tropical2002, SPEI2002 | Južnobanatski district, Severnobanatski district, Srednjebanatski district, Podunavski district | 11.700 | |
| B3 | AgriLand2002, Tropical2002, SPEI2002 | Zlatiborski district, Raški district, Pirotski district, Pčinjski district | 14.125 | |
| B4 | AgriLand2002, PFGO2002, Tropical2002, SPEI2002 | Grad Beograd, Sremski district, Mačvanski district, Pomoravski district | 15.525 | |
| B5 | AgriPop2002, PFGO2002, Tropical2002, SPEI2002 | Zapadnobački district, Južnobački district, Severnobački district | 11.900 | |
| Source: Authors’ calculations | ||||
It is also valuable to explore which environmental variables were used to define each segment. In B1 and B3, more importance is given to the percentage of agricultural land, the Average number of tropical days and SPEI. Bicluster 2 accounts for both agricultural land and population, as well as two drought measurements, while bicluster 4 focuses on up to four environmental variables, suggesting that in these regions both agriculture and drought are present. It is worth noting that all five drought damage variables were used in segment creation, and both Tropical and SPEI were used to form all retained segments.
Figure 2 presents a bar chart showing which environmental variables contributed to each bicluster, along with the mean values of these variables within each segment. The chart also includes the mean for each variable, allowing for a clear comparison between each segment and the overall sample. Within B1, the algorithm grouped districts with below-average proportions of agricultural land (mean=58.31) and Average number of tropical days (mean=17.41). The second segment, B2, encompasses districts with low SPEI (-1.44), indicating drought, but with an above-average proportion of agricultural land (mean=85.175). B3 captured districts with a lower percentage of agricultural land (mean=53.95) and Average number of tropical days (mean=7.20). The following segment, B4, is characterised by a higher share of PFGO (mean=87.45) and a slightly above-average number of tropical days (mean=26.32). The final segment shows a below-mean agricultural population, an above-mean PFGO (mean=93.17), and an above-mean Average number of tropical days (mean=37.25).
Figure 2. Bar chart on drought damage variables in each of the obtained segments for the year 2002.
Source: Authors’ calculations
4.3 Segmentation Results 2011
The same biclustering algorithm was applied to the dataset for the year 2011. The resulting segmentation metrics indicated a satisfactory fit. Of the 25 observed districts, 24 were successfully assigned to segments, while the Zlatiborski district remained unsegmented. As much as 96% of the sample was segmented, which is favourable. Table 4 presents the statistics for the district segments obtained through biclustering for 2011. Bicluster 1 is the largest bicluster by dimensions, encompassing six districts and four variables. This segment covers almost all of the Vojvodina region, plus the Podunavski district. Segment 2 covers three southern regions and two districts of West Serbia (Mačvanski and Raški districts). The following segment (B3) covers the Šumadijski, Kolubarski, and Pomoravski districts (Central Serbia) and the Nišavski and Braničevski districts (Eastern and Southern Serbia). The same variables were used to form segments B4 and B5. Within Table 4, we also present the results of the comparison of the district segments regarding the Emigration rate. The results indicate that there is no statistically significant difference between the segments in emigration rates in 2011 (ANOVA: F=1.684, p>0.05). The differences between segments created for the 2011 data regarding the emigration rate have been applied to the 2012–2022 emigration rate. No statistical differences were found; all ten additionally conducted ANOVAs showed p>0.05. The only year in which the results were close to statistically significant was 2014 (F=2.536, p=0.074).
| Bicluster | Environmental variables defining the segment | Districts | Mean Emigration rate | ANOVA |
|---|---|---|---|---|
| B1 | AgriPop2011, PFGO2011, Tropical2011, SPEI2011 | Zapadnobački district, Južnobanatski district, Južnobački district, Severnobački district, Sremski district, Podunavski district | 12.633 | 1.684 (p>0.05) |
| B2 | AgriLand2011, Tropical2011, SPEI2011 | Moravički district, Raški district, Pirotski district, Pčinjski district, Toplički district | 14.900 | |
| B3 | AgriLand2011, Tropical2011, SPEI2011 | Kolubarski district, Pomoravski district, Rasinski district, Šumadijski district, Braničevski district, Nišavski district | 13.400 | |
| B4 | PFGO2011, Tropical2011, SPEI2011 | Grad Beograd, Severnobanatski district, Srednjebanatski district, Mačvanski district | 17.375 | |
| B5 | PFGO2011, Tropical2011, SPEI2011 | Borski district, Zaječarski district, Jablanički district | 14.800 | |
| Source: Authors’ calculations | ||||
Figure 3 presents a bar chart showing that, within B1, the algorithm grouped districts by the proportion of PFGO above the mean (mean=92.49), the agricultural population slightly below the sample mean (mean=14.46), and the Average number of tropical days above the mean (45.42). The second segment, B2, encompasses districts with a lower percentage of agricultural land (mean=54.33), and a lower Average number of tropical days (mean=24.37). B3 captured districts with around-sample-mean percentages of agricultural land (mean=64.94) and a slightly higher Average number of tropical days (mean=45.68). The following segments, B4 and B5, are formed using the same variables. However, in B4, the algorithm grouped districts with higher percentages of PFGO (mean B4=85.27 and mean B5=51.48) and a higher Average number of tropical days (mean B4=45.68 and mean B5=37.94) than in B5. It is worth noting that, again in 2011, all variables were used to form the segments. At the same time, two variables were used to define all five segments: Tropical and SPEI. The lowest measured mean SPEI is -2.13 (B5), while the highest measured mean is -1.68 (B3).
Figure 3. Bar chart on drought damage variables in each of the obtained segments for the year 2011.
Source: Authors’ calculations
4.4 Segmentation Results 2022
The same approach presented above was applied to the 2022 dataset. Of the 25 observed districts of Serbia, 4 were not successfully assigned to segments (Grad Beograd, Srednjebanatski district, Zlatiborski district and Borski district). Table 5 presents the statistics for the formed district segments. The structure of segment B5 attracts attention. The BCCC algorithm identifies B5 based on co-occurring structural similarities rather than extreme values, capturing a shared agro-climatic profile among the three districts. Specifically, these regions are characterised by a visible share of agricultural land, moderate climatic exposure, and negative SPEI values, indicating a comparable balance between land use intensity and environmental conditions shaping agricultural activity.
| Bicluster | Environmental variables defining the segment | Districts | Mean Emigration rate | ANOVA |
|---|---|---|---|---|
| B1 | AgriPop2022, PFGO2022, Tropical2022, SPEI2022 | Zapadnobački district, Južnobanatski district, Južnobački district, Severnobački district, Sremski district, Podunavski district | 17.898 | 1.671 (p>0.05) |
| B2 | AgriPop2022, AgriLand2022, Tropical2022, SPEI2022 | Pomoravski district, Rasinski district, Braničevski district, Zaječarski district, Jablanički district, Nišavski district | 20.171 | |
| B3 | AgriPop2022, AgriLand2022, Tropical2022, SPEI2022 | Moravički district, Raški district, Pirotski district, Pčinjski district | 17.625 | |
| B4 | AgriPop2022, PFGO2022, SPEI2022 | Severnobanatski district, Mačvanski district | 23.703 | |
| B5 | AgriLand2022, Tropical2022 | Kolubarski district, Šumadijski district, Toplički district | 18.951 | |
| Source: Authors’ calculations | ||||
Within Table 5, we also present the results of the comparison of the district segments regarding the Emigration rate. The results indicate that there is no statistically significant difference between the segments in Emigration rate in 2022. The segment comparisons for 2023–2024 Emigration rate also showed no statistically significant differences, as both conducted ANOVAs showed p>0.05.
Figure 4 presents a bar chart showing that, within B1, the algorithm grouped districts by the proportion of the agricultural population (mean=7.21), PFGO (mean=96.18), and Average number of tropical days (mean=59.96) above the sample mean, and by SPEI below the mean (mean=-2.29). The second segment, B2, encompasses districts with a lower percentage of agricultural land (mean=45.55), slightly fewer tropical days (mean=43.06), and a higher SPEI (mean=-1.67). B3 looks similar to B2, however, the Average number of tropical days was visibly lower (mean=21.54) than the sample mean. The segment B4 is characterised by high PFGO (mean=90.75), while segment B5 is formed using just two variables, AgriLand and Tropical. In this case, the AgriLand (mean=52.80) and Tropical (mean=37.05) are below the sample mean. This time, no variable was used to form all five segments.
Figure 4. Bar chart on drought damage variables in each of the obtained segments for the year 2022.
Source: Authors’ calculations
4.5 Segment Structures Comparison
After performing the segmentation analysis for each of the three periods, this subsection presents a comparison of the results, namely the segment structures. We focused on the membership of districts in different segments over time. To illustrate these changes, we created a Sankey diagram, a flow visualisation that emphasises transitions across periods (Figure 5). The segments coloured in blue are retained segments, while the grey segment represents districts that were not segmented in that year.
Figure 5. Segment membership of Serbian districts (2002–2022).
Source: Authors’ calculations
The initial B1 was divided, but interestingly, certain districts remained together in different segments in the later periods. The Braničevski, Nišavski, and Rasinski districts moved to B3 in 2011 and later to B2 in 2022. The Šumadijski district was highly volatile, moving from unsegmented to B3 and finally to B5. Grad Beograd also showed variability, being in B4 in 2002 and 2011, and not being segmented in 2022. The Zlatiborski district was not segmented in both 2011 and 2022. The Mačvanski district stayed in Segment 4 across all three years, being the only fully stable district. Pčinjski and Pirotski districts also moved together throughout, both located in B3 in 2002, going to B2 in 2011, and returning to B3 in 2022, suggesting a shared structural profile. Južnobački, Severnobački, and Zapadnobački districts remained grouped into different segments over the years.
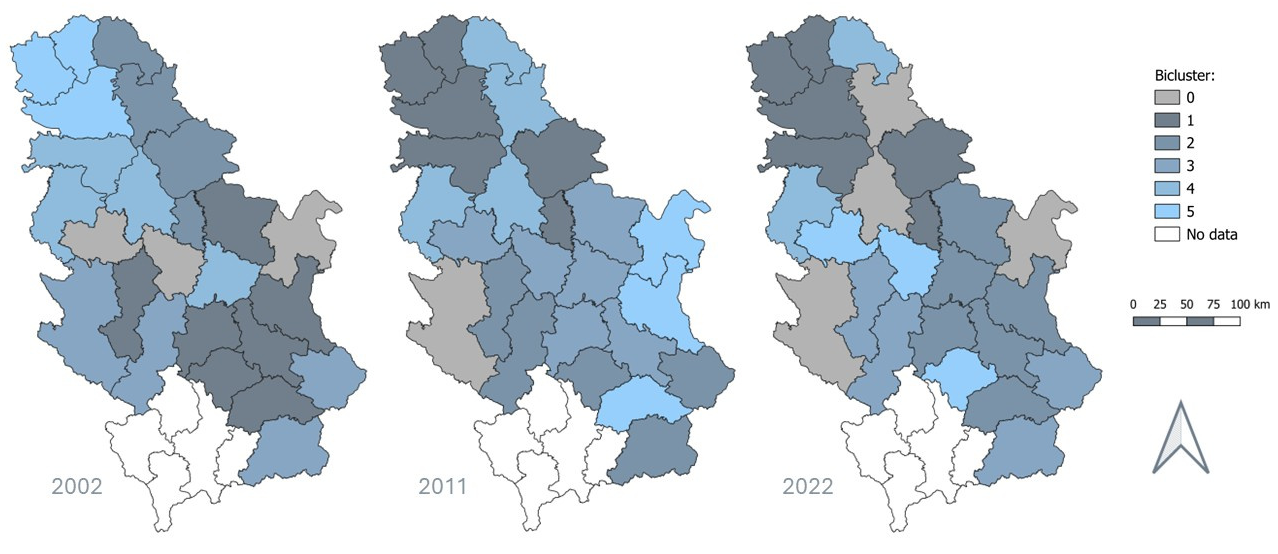
Figure 6 presents district-level maps of the biclustering results for each observed year in Serbia, enabling visual assessment of spatial patterns, regional differentiation, and temporal dynamics in district segmentation. This spatial representation complements the quantitative results by highlighting geographic clustering and the stability or transition of districts across segments over time.
Figure 6. District-level maps of the segmentation results (2002–2022)
Source: Authors’ calculations and administrative boundaries obtained from GeoSrbija (Republic Geodetic Authority, 2023). Designed in QGIS 3.36.3.
5 DISCUSSION
This study started with three main research questions: to observe whether the drought parameters at the district level in Serbia changed between 2002 and 2022 and in what way; in what way the districts can be segmented based on the measured drought vulnerability; and whether there are differences among the defined districts in the internal emigration rate.
In the first research question, the analysis clearly shows that, at the district level, drought parameters increased over the 20-year period. Of the six observed variables, in the first comparison period (2002–2011), values for four variables show statistically significant change. The average percentage of the agricultural population decreased, as well as SPEI, indicating more drought. PFGO slightly decreased, while the Average number of tropical days increased on average by 15 days (mean2002=22.967, mean2011=38.057). In the second comparison period (2011–2022), values of all variables except SPEI display statistically significant change. The share of the agricultural population continued to decline, and the share of agricultural land decreased sharply. PFGO, the average number of tropical days, and the Emigration rate increased. Another aspect that attracts attention is the temporal evolution of the variation among districts. For some variables, the variation is stable during the observation period (PFGO, AgriLand, and Emigration rate). This indicates that even if the mean values changed over time, all districts experienced the same magnitude of change. On the other hand, the variation of AgriPop between districts is decreasing, indicating convergence over time. Similar to previous studies, depopulation of rural areas and the shift from agricultural to non-agricultural activities have been confirmed as general trends across all districts (Vojković & Gligorijević, 2022; Nikitović, 2025), regardless of the severity of drought. Levene’s test revealed a statistically significant difference in the variance of the agricultural population across the three observed time points (F(2, 72) = 5.513, p=0.006), indicating that the dispersion of values was not homogeneous over time. The mean share of the agricultural population decreased substantially from 25.55% (SD=9.12) in 2002 to 18.41% (SD=8.76) in 2011 and further to 6.52% (SD=3.09) in 2022. The concurrent decline in standard deviations suggests a process of convergence among the districts; as the agricultural population diminished overall, the differences between districts narrowed considerably, resulting in a more homogeneous spatial distribution by 2022.
The Average number of tropical days not only showed a clear increase but, more importantly, exhibited markedly greater variability, indicating divergence and rising disparities in districts’ exposure to thermal shocks and climate change.
The segmentation analysis revealed differences among districts in drought vulnerability. Across all three time periods studied, five distinct segments were consistently identified. While some segments exhibited clear regional patterns in certain years (for example, Južnobački, Severnobački, and Zapadnobački districts of Vojvodina, which were grouped together at all three time points), others grouped districts that were neither geographically nor environmentally proximate, highlighting that drought vulnerability does not always align with traditional spatial boundaries, and climatic parameters only (for example, Segments B4 and B5 in 2022). In 2002, the two segments with the highest mean Emigration rate differed visibly in their structure. In B3, AgriLand is well below the mean, as is the Average number of tropical days. In B4, PFGO is above the mean, while AgriLand and the Average number of tropical days are on or slightly above the mean.
In 2011, although all segments were dominated by drought (SPEI) and the Average number of tropical days in combination with agricultural variables, these different combinations did not translate into substantial differences in emigration outcomes. Evidently, the analysed environmental stressors alone were insufficient to differentiate migration behaviour across districts in 2011 in a manner that the applied methodology could capture. Mean Emigration rates across the five segments vary within a narrow range (12.633–17.375), indicating limited differentiation between environmentally defined district groups in that year.
In the final observed period, 2022, the highest mean Emigration rate is observed in B4 (23.703), a segment characterised by agricultural population (AgriPop), high forest and grassland expansion (PFGO), and drought conditions (SPEI). Segments B1 and B3, despite exposure to climatic stressors, show lower average Emigration rates. As in 2002 and 2011, the 2022 ANOVA test (F=1.671, p>0.05) indicated no statistically significant differences in mean Emigration rates among environmentally defined segments.
A notable observation from the segmentation analysis is that certain districts remained unsegmented across multiple periods (Beograd, Zlatiborski, and Borski districts). Rather than treating these cases as outliers, their persistent exclusion from segments indicates substantive interpretation. Belgrade, as the capital and by far the largest urban agglomeration, has an environmental and demographic profile that is fundamentally distinct from all other districts. Zlatiborski and Borski districts, located in western and eastern Serbia, respectively, are characterised by mountainous terrain, extensive forest cover, and relatively low levels of land cultivation, which may place them outside the environmental patterns captured by the drought-oriented variables used for segmentation.
An important finding of this study is that the ANOVA results did not reveal statistically significant differences in emigration rates between the environmentally defined segments in any of the three observed time periods. Rather than treating this as a limitation, we argue that this null result carries valuable insights. It suggests that, at the NUTS 3 level in Serbia, drought and agricultural conditions alone are not primary differentiators of emigration behaviour, which is a finding consistent with the broader literature emphasising that environmental factors tend to operate as amplifiers of existing socio-economic vulnerabilities rather than as independent migration drivers (Piguet et al., 2018).
Drought-related migration rarely unfolds in a simple push–pull response, with local and regional economic, political, social and other non-environmental factors influencing the adaptation and migration responses that may occur. In other words, the drought-migration relationship is multidirectional (Hermans & McLeman, 2021; Karutz & Kabisch, 2023). For example, a study from Ethiopia showed that male-headed households had substantially higher migration rates during drought periods than female-headed households (Mersha & van Laerhoven, 2016). This finding may be particularly relevant for understanding migration responses in elderly single-person households in southern and eastern Serbia, where drought impacts are among the most pronounced. Moreover, rural agrarian communities are often reluctant to abandon their traditional ways of life, while limited awareness, insufficient capital, poor infrastructure, and restricted market access further constrain adaptation strategies and migration (Dilrukshi & Koralagama, 2025). However, some studies indicate that the effect of drought on out-migration is particularly pronounced in highly agricultural areas, although this relationship is often moderated by fluctuations in agricultural product prices and broader economic conditions (Delacrétaz et al., 2023). Other research suggests that repeated drought events may actually constrain migration by reducing households’ financial capacity and limiting their ability to migrate (Thalheimer et al., 2022). Another important aspect is that members of the most vulnerable households engage primarily in temporary (seasonal) migration (Sarkar et al., 2022; Sarkar, 2025), which often remains unrecorded in official migration statistics. Therefore, the absence of a clear and straightforward relationship between drought and registered internal migration reflects both the complexity of migration responses and the limitations of available migration data.
6 CONCLUSION
This study highlights changes in environmental challenges across Serbia at the NUTS 3 level and identifies persistent challenges. In addition to the marked similarity in the decline of agricultural activity across districts, climatic variables exhibit greater differences and increasing divergence, although their decisive influence on the dynamics of internal emigration rates has not been observed. Another important finding is that the dynamics of the observed variables have changed over time, with increasing importance of heat-related parameters and decreasing importance of agricultural activity parameters in differentiating between districts.
The findings underscore the importance of tailored, evidence-based policies that address district-specific and variable-specific inequalities to promote greater equity across the country. The study contributes to the literature on intraregional inequalities in Serbia, distinguishing itself from previous work through the use of an advanced biclustering segmentation algorithm and a focus on environmental and agricultural variables, while also accounting for population dynamics. Overall, the study sheds light on both similarities and differences among districts in their drought challenges and provides guidance for a deeper understanding of internal migration.
Over the past three decades, the Republic of Serbia has experienced several severe drought years (e.g. 2000, 2003, 2012, and 2024). However, certain districts—such as Zaječarski, Beogradski, Borski, and Pirotski—have been particularly affected by more intense precipitation deficits. Population vulnerability increases when drought conditions occur consecutively over several years, as observed in the Pirotski and Zaječarski districts between 2011 and 2013. The Average number of tropical days was also unevenly distributed across districts. The highest values were recorded in Južnobanatski, Podunavski, and Srednjobanatski districts. Future research could further examine the impact of these extreme drought and hot periods on emigration rates.
The study presented should be interpreted with its limitations in mind. Although it takes time into consideration, the study examines three snapshots from 2002, 2011, and 2022. While the three census years provide valuable longitudinal anchors, they capture population stocks rather than migration flows, meaning that emigration between censuses is inferred rather than directly observed. Importantly, the intercensal periods encompass major socio-economic disruptions: the 2008 global financial crisis falls within the 2002–2011 interval, while the 2011–2022 interval includes the COVID-19 pandemic. Future studies could benefit from incorporating annual or sub-annual migration flow data where available, to better isolate the temporal dynamics of environment-driven mobility from the effects of economic and political shocks. Also, to observe the longitudinal aspects, methods for clustering longitudinal data could be applied (Lu, 2025).
As the study was conducted using district-level data, it would be of interest to observe and assess the individuals’ self-reported affectedness by environmental changes (Freihardt, 2025). Another limitation of the study concerns the data and the complexity of the segmentation. In this study, we focused solely on five drought-agriculture nexus variables. In future studies, the list of variables used to form the segments could be extended, especially as the biclustering algorithms perform on high-dimensional data (Kaiser, 2011). Besides focusing solely on environmental drought data, socio-economic and political data could also be considered. Additionally, this study employed biclustering, an algorithmically more complex segmentation approach that, unlike standard clustering, identifies which subset of variables defines each segment. A future study could systematically compare segmentation solutions obtained through biclustering and conventional clustering algorithms (e.g., hierarchical or k-means), examining both the consistency of segment membership and any differences in the patterns captured by each method.
This research was supported by the Science Fund of the Republic of Serbia, Grant no. 7358, Population dynamics under environmental challenges in Serbia – POPENVIROS.
Data availability statement
Data are available from the authors upon request.
Coauthor contributions
Milica Maričić: Conceptualisation, Methodology, Data Analysis, Writing - Original Draft
Petar Vasić: Conceptualisation, Investigation, Writing - Original Draft, Writing - Review & Editing
Tijana Jakovljević: Data collection, Data preparation, Visualisation, Writing - Review & Editing
Miloš Milovanović: Methodology, Data preparation, Data Analysis
References
- Arsenović, D. (2018). Seasonality in human mortality: Results for the City of Novi Sad (Serbia). Stanovništvo, 56(1), 27-42. https://doi.org/10.2298/STNV1801027A
- Bezdan, J., Bezdan, A., Blagojević, B., Mesaroš, M., Pejić, B., Vranešević, M., Pavić, D., & Nikolić-Đorić, E. (2019). SPEI-based approach to agricultural drought monitoring in Vojvodina region. Water, 11(7), 1481. https://doi.org/10.3390/w11071481
- Bretschger, L., & Xepapadeas, A. (2025). The great divide: Environmental migration as a response to climate change and policy in North and South. Environmental and Resource Economics, 88(11), 2815-2844. https://doi.org/10.1007/s10640-025-00976-0
- Cheng, Y., & Church, G. M. (2000). Proceedings of the Eighth International Conference on Intelligent Systems for Molecular Biology. Eighth International Conference on Intelligent Systems for Molecular Biology (ISMB 2000), San Diego, California, USA. https://aaai.org/papers/ismb00-010-biclustering-of-expression-data/
- De Longueville, F., Zhu, Y., & Henry, S. (2019). Direct and indirect impacts of environmental factors on migration in Burkina Faso: Application of structural equation modelling. Population and Environment, 40(4), 456-479. https://doi.org/10.1007/s11111-019-00320-x
- de Sherbinin, A., Carr, D., Cassels, S., & Jiang, L. (2007). Population and environment. Annual Review of Environment and Resources, 32, 345-373. https://doi.org/10.1146/annurev.energy.32.041306.100243
- de Smet, D. (2019). A Biclustering Approach to Symptom Clusters and Subgroup Identification in Non-Hodgkin Lymphoma Survivors. http://arno.uvt.nl/show.cgi?fid=149565
- Delacrétaz, N., Lanz, B., Delju, A. H., Piguet, E., & Rebetez, M. (2023). Impacts of rainfall shocks on out-migration are moderated more by per capita income than by agricultural output in Türkiye. Population and Environment, 45(3), 12. https://doi.org/10.1007/s11111-023-00423-6
- Dilrukshi, M. W. K. K., & Koralagama, D. N. (2025). Livelihood vulnerability of drought-affected agro-migrants in dry zone of Sri Lanka. Tropical Agricultural Research & Extension, 28(4), 235-246. https://doi.org/10.4038/tare.v28i4.5791
- Djurdjević, V., Stosic, B., Tošić, M., Lazić, I., Putniković, S., Stosic, T., & Tošić, I. (2024). Analysis of recent trends and spatiotemporal changes of droughts over Serbia using high-resolution gridded data. Atmospheric Research, 304, 107376. https://doi.org/10.1016/j.atmosres.2024.107376
- Dragićević, S., Novković, I., & Jakovljević, T. (2025). D4.1 Izveštaj o životnoj sredini u Srbiji. https://popenviros-prizma.com/library-2/reports/
- Drobnjaković, M., Panić, M., & Đorđević, J. (2016). Traditional undeveloped municipalities in Serbia as a result of regional inequality. European Planning Studies, 24(5), 926-949. https://doi.org/10.1080/09654313.2015.1129396
- Eurostat. (2025). NUTS – Nomenclature of territorial units for statistics: Correspondence tables. https://ec.europa.eu/eurostat/web/nuts/correspondence-tables
- Filipović, L., Putniković, S., Stosic, B., Stosic, T., Djurdjević, V., & Tošić, I. (2025). Analysis of spatio-temporal characteristics of drought in Serbia from 1961 to 2020 using SPI and SPEI. International Journal of Climatology, 45(7), e8803. https://doi.org/10.1002/joc.8803
- Freihardt, J. (2025). Environmental shocks and migration among a climate-vulnerable population in Bangladesh. Population and Environment, 47, 6. https://doi.org/10.1007/s11111-025-00478-7
- García-León, D., Masselot, P., Mistry, M. N., Gasparrini, A., Motta, C., Feyen, L., & Ciscar, J.-C. (2024). Temperature-related mortality burden and projected change in 1368 European regions: A modelling study. The Lancet Public Health, 9(9), e644-e653. https://doi.org/10.1016/S2468-2667(24)00179-8
- Ghosh, R. C., & Orchiston, C. (2022). A systematic review of climate migration research: Gaps in existing literature. SN Social Sciences, 2, 47. https://doi.org/10.1007/s43545-022-00341-8
- Gligorijević, V., & Bakić, D. (2025). Planska i normativna zaštita prostora i životne sredine – Zbornik radova (D. Filipović, V. Šećerov, D. Ristić, & M. Ilić, Eds.). https://doi.org/10.5937/PNZPZS25275G
- Henry, S., Schoumaker, B., & Beauchemin, C. (2004). The impact of rainfall on the first out-migration: A multi-level event-history analysis in Burkina Faso. Population and Environment, 25(5), 423-460. https://doi.org/10.1023/B:POEN.0000036928.17696.e8
- Hermans, K., & McLeman, R. (2021). Climate change, drought, land degradation and migration: Exploring the linkages. Current Opinion in Environmental Sustainability, 50, 236-244. https://doi.org/10.1016/j.cosust.2021.04.013
- Jeremić, V., Janković, V., Maričić, M., & Labus, A. (2025). 2025 6th International Workshop on Engineering Technologies and Computer Science (EnT). 2025 6th International Workshop on Engineering Technologies and Computer Science (EnT), Saint Petersburg, Russia. https://doi.org/10.1109/EnT68818.2025.11269596
- Joksimović, M., & Golić, R. (2017). Indicators of regional inequality in Serbia. Collection of Papers – Faculty of Geography at the University of Belgrade, 65(1a), 227-249. https://doi.org/10.5937/zrgfub1765227J
- Jovanović, T., Mitrović, K., & Erdei, I. (2023). Moving while waiting for the future: Mobility and education in Šid, Serbia. Journal of Borderlands Studies, 38(2), 229-246. https://doi.org/10.1080/08865655.2022.2048679
- Kaiser, S. (2011). Biclustering: Methods, Software and Application. https://doi.org/10.5282/edoc.13073
- Karutz, R., & Kabisch, S. (2023). Exploring the relationship between droughts and rural-to-urban mobility—A mixed methods approach for Pune, India. Frontiers in Climate, 5, 1168584. https://doi.org/10.3389/fclim.2023.1168584
- Leisch, F., & De Troyer, E. (2020). Biclust: BiCluster Algorithms. https://doi.org/10.32614/CRAN.package.biclust
- Lindenmayer, D. B., Likens, G. E., Andersen, A., Bowman, D., Bull, C. M., Burns, E., Dickman, C. R., Hoffmann, A. A., Keith, D. A., Liddell, M. J., Lowe, A. J., Metcalfe, D. J., Phinn, S. R., Russell-Smith, J., Thurgate, N., & Wardle, G. M. (2012). Value of long-term ecological studies. Austral Ecology, 37(7), 745-757. https://doi.org/10.1111/j.1442-9993.2011.02351.x
- Lu, Z. (2025). Clustering longitudinal data: A review of methods and software packages. International Statistical Review, 93(3), 425-458. https://doi.org/10.1111/insr.12588
- Malinić, V., Sedlak, M., Krstić, F., Joksimović, M., Golić, R., Gajić, M., Vujadinović, S., & Šabić, D. (2025). Land cover changes in the rural border region of Serbia affected by demographic dynamics. Land, 14(8), 1663. https://doi.org/10.3390/land14081663
- Marinković, I., & Potić, I. (2025). The impact of low temperatures on mortality in Vojvodina (2000–2020): A quantitative analysis of cold spells. International Journal of Biometeorology, 69(9), 2237-2247. https://doi.org/10.1007/s00484-025-02960-1
- Matthews, T., & Potts, R. (2018). Planning for climigration: A framework for effective action. Climatic Change, 148(4), 607-621. https://doi.org/10.1007/s10584-018-2205-3
- Mersha, A. A., & van Laerhoven, F. (2016). A gender approach to understanding the differentiated impact of barriers to adaptation: Responses to climate change in rural Ethiopia. Regional Environmental Change, 16(6), 1701-1713. https://doi.org/10.1007/s10113-015-0921-z
- Ministarstvo poljoprivrede i zaštite životne sredine. (2017). Izazovi klimatskih promena na teritoriji Beograda i Republike Srbije. https://www.ekologija.gov.rs/lat/saopstenja/vesti/izazovi-klimatskih-promena-na-teritoriji-beograda-i-republike-srbije
- Ministry of Environmental Protection. (2022). Digital climate and climate change atlas of the Republic of Serbia [Data set]. https://atlas-klime.eko.gov.rs/eng/files
- Ministry of Interior of the Republic of Serbia. (2025). Disaster Risk Register of the Republic of Serbia. https://drr.geosrbija.rs/drr/
- Mirić, N. (2026). The effect of hot days on birth rates in Serbia: Regional aspect. Spatial Demography, 14, 2. https://doi.org/10.1007/s40980-025-00155-1
- Molla, A. (2025). Extreme heat and human fertility: Amplified challenges in the era of climate change. Journal of Thermal Biology, 130, 104158. https://doi.org/10.1016/j.jtherbio.2025.104158
- Molnar, D., & Jandrić, M. (2019). Unutarregionalne nejednakosti u Srbiji – testiranje klupske konvergencije [Intraregional inequalities in Serbia: Testing the club convergence]. Zbornik Matice Srpske Za društvene Nauke, 70(169), 91-108. https://doi.org/10.2298/ZMSDN1969091M
- Nikitović, V. (Ed.). (2025). Stanovništvo Srbije – dinamika i strukture. Republički zavod za statistiku. https://publikacije.stat.gov.rs/G2025/Pdf/G20254001.pdf
- Osland, M. J., Chivoiu, B., Enwright, N. M., Thorne, K. M., Guntenspergen, G. R., Grace, J. B., Dale, L. L., Brooks, W., Herold, N., Day, J. W., Sklar, F. H., & Swarzenzki, C. M. (2022). Migration and transformation of coastal wetlands in response to rising seas. Science Advances, 8(26), eabo5174. https://doi.org/10.1126/sciadv.abo5174
- Piguet, E., Kaenzig, R., & Guélat, J. (2018). The uneven geography of research on “environmental migration”. Population and Environment, 39(4), 357-383. https://doi.org/10.1007/s11111-018-0296-4
- Pontes, B., Giráldez, R., & Aguilar-Ruiz, J. S. (2015). Biclustering on expression data: A review. Journal of Biomedical Informatics, 57, 163-180. https://doi.org/10.1016/j.jbi.2015.06.028
- Pradhan, K. C., & Narayanan, K. (2020). Weather variation and temporary labor migration: A panel data analysis for select semi-arid villages in India. Migration and Development, 9(2), 291-322. https://doi.org/10.1080/21632324.2019.1605745
- Predojević-Despić, J., & Penev, G. (2016). Population of Serbia abroad by destination countries: Regional approach. Bulletin of the Serbian Geographical Society, 96(2), 83-106. https://doi.org/10.2298/GSGD1602082P
- Project team ECA&D. (2013). European Climate Assessment & Dataset (ECA&D): Algorithm Theoretical Basis Document (ATBD). Royal Netherlands Meteorological Institute KNMI. https://www.ecad.eu/documents/atbd.pdf
- Republic Geodetic Authority. (2023). Administrative spatial datasets [Data set]. GeoSrbija geoportal. https://download.geosrbija.rs/download/download
- Sarkar, B. (2025). An assessment of the impact of temporary migration on household adaptive capacity to climate variability (e.g., drought) in rural India. Rural and Regional Development, 3(3), 10010. https://doi.org/10.70322/rrd.2025.10010
- Sarkar, B., Dutta, S., & Singh, P. K. (2022). Drought and temporary migration in rural India: A comparative study across different socio-economic groups with a cross-sectional nationally representative dataset. PLOS ONE, 17(10), e0275449. https://doi.org/10.1371/journal.pone.0275449
- Singh, R., Singh, H., & Raghubanshi, A. S. (2019). Challenges and opportunities for agricultural sustainability in changing climate scenarios: A perspective on Indian agriculture. Tropical Ecology, 60(2), 167-185. https://doi.org/10.1007/s42965-019-00029-w
- Spalević, A. (2009). Mogućnosti za razvoj ruralnog područja u Republici Srbiji. Journal of the Geographical Institute “Jovan Cvijić” SASA, 59(2), 133-147. https://doi.org/10.2298/IJGI0902133S
- Stamenković, M., Milanović, M., & Janković-Milić, V. (2021). Multivariate statistical analysis of regional economic disparities at district level in Serbia. TEME, 45(2), 681-698. https://doi.org/10.22190/TEME200715039S
- Statistical Office of the Republic of Serbia. (2025). Population of Serbia - dynamics and structures, 2022. https://www.stat.gov.rs/en-us/publikacije/publication/?p=17245&tip=4
- Stojanović, D., Orlović, S., Zlatković, M., Kostić, S., Vasić, V., Miletić, B., Kesić, L., Matović, B., Božanić, D., Pavlović, L., Milović, M., Pekeč, S., & Đurđević, V. (2021). Climate change within Serbian forests: Current state and future perspectives. Topola/Poplar, 208, 39-56. https://doi.org/10.5937/topola2108039S
- Stojilković Gnjatović, J., Todorović, N., Vračević, M., & Devedžić, M. (2025). Book of Abstracts of the International Scientific Conference “Population and Environment: Challenges and Perspectives” (N. Mirić, Ed.).
- Stosic, B., Djurdjević, V., Tošić, M., Lazić, I., Tošić, I., & Stosic, T. (2024). Generalized weighted permutation entropy analysis of SPEI index in Serbia as a proxy of corn production. International Journal of Climatology, 44(10), 3514-3528. https://doi.org/10.1002/joc.8536
- Stosic, T., Tošić, I., Lazić, I., Tošić, M., Filipović, L., Djurdjević, V., & Stosic, B. (2024). Multifractal analysis of Standardized Precipitation Evapotranspiration Index in Serbia in the context of climate change. Sustainability, 16(22), 9857. https://doi.org/10.3390/su16229857
- Thalheimer, L., Choquette-Levy, N., & Garip, F. (2022). Compound impacts from droughts and structural vulnerability on human mobility. IScience, 25(12), 105491. https://doi.org/10.1016/j.isci.2022.105491
- Todorović, M., Drobnjaković, M., & Gligić-Simeunović, A. (2010). Specifics of rural areas of Serbia from the aspects of regional development. Economics of Agriculture, 57(Spec. num. 2), 605-612. https://www.ea.bg.ac.rs/index.php/EA/article/view/1046
- Vojković, G., … Gligorijević, V. (Eds.). (2022). Stanovništvo Srbije – kako upravljati demografskim izazovima. Univerzitet u Beogradu – Geografski fakultet.
- Vuković, A. J., Vujadinović, M. P., Rendulić, S. M., Đurđević, V. S., Ruml, M. M., Babić, V. P., & Popović, D. P. (2018). Global warming impact on climate change in Serbia for the period 1961-2100. Thermal Science, 22(6 Part A), 2267-2280. https://doi.org/10.2298/TSCI180411168V
- Vuković, D. (2005). Migrations of the labour force from Serbia. SEER – South-East Europe Review for Labour and Social Affairs, 8(4), 139-150. https://www.jstor.org/stable/43293135
- Vuković-Vimić, A., & Vujadinović-Mandić, M. (2024). Dynamics of change of climate conditions and extreme weather events in Serbia. Matica Srpska Journal for Natural Sciences, 147, 33-45. https://doi.org/10.2298/ZMSPN2447033V
- Zakon o smanjenju rizika od katastrofa i upravljanju vanrednim situacijama (2018). Službeni glasnik Republike Srbije, br. 87/2018. https://www.parlament.gov.rs/upload/archive/files/lat/pdf/zakoni/2018/3278-18-lat.pdf
- Zhang, X. P., Pu, H. Z., Cao, Q., Ji, Q., Xiang, Q., Wang, W. Z., & Zhong, W. (2025). Potential drivers of human migration under climate change: A review. Applied Ecology and Environmental Research, 23(6), 10703-10734. https://doi.org/10.15666/aeer/2306_1070310734
- Živanović, Z., & Gatarić, D. R. (2017). Differences in regional development on the territory of the Republic of Serbia. Bulletin of Geography. Socio-Economic Series, 35(35), 145-154. https://doi.org/10.1515/bog-2017-0010
Article Details
Published by the Institute of Social Sciences - Center for Demographic Research




References
Bezdan, J., Bezdan, A., Blagojević, B., Mesaroš, M., Pejić, B., Vranešević, M., Pavić, D., & Nikolić-Đorić, E. (2019). SPEI-based approach to agricultural drought monitoring in Vojvodina region. Water, 11(7), 1481. https://doi.org/10.3390/w11071481
Bretschger, L., & Xepapadeas, A. (2025). The great divide: Environmental migration as a response to climate change and policy in North and South. Environmental and Resource Economics, 88(11), 2815-2844. https://doi.org/10.1007/s10640-025-00976-0
Cheng, Y., & Church, G. M. (2000). Proceedings of the Eighth International Conference on Intelligent Systems for Molecular Biology. Eighth International Conference on Intelligent Systems for Molecular Biology (ISMB 2000), San Diego, California, USA. https://aaai.org/papers/ismb00-010-biclustering-of-expression-data/
De Longueville, F., Zhu, Y., & Henry, S. (2019). Direct and indirect impacts of environmental factors on migration in Burkina Faso: Application of structural equation modelling. Population and Environment, 40(4), 456-479. https://doi.org/10.1007/s11111-019-00320-x
de Sherbinin, A., Carr, D., Cassels, S., & Jiang, L. (2007). Population and environment. Annual Review of Environment and Resources, 32, 345-373. https://doi.org/10.1146/annurev.energy.32.041306.100243
de Smet, D. (2019). A Biclustering Approach to Symptom Clusters and Subgroup Identification in Non-Hodgkin Lymphoma Survivors. http://arno.uvt.nl/show.cgi?fid=149565
Delacrétaz, N., Lanz, B., Delju, A. H., Piguet, E., & Rebetez, M. (2023). Impacts of rainfall shocks on out-migration are moderated more by per capita income than by agricultural output in Türkiye. Population and Environment, 45(3), 12. https://doi.org/10.1007/s11111-023-00423-6
Dilrukshi, M. W. K. K., & Koralagama, D. N. (2025). Livelihood vulnerability of drought-affected agro-migrants in dry zone of Sri Lanka. Tropical Agricultural Research & Extension, 28(4), 235-246. https://doi.org/10.4038/tare.v28i4.5791
Djurdjević, V., Stosic, B., Tošić, M., Lazić, I., Putniković, S., Stosic, T., & Tošić, I. (2024). Analysis of recent trends and spatiotemporal changes of droughts over Serbia using high-resolution gridded data. Atmospheric Research, 304, 107376. https://doi.org/10.1016/j.atmosres.2024.107376
Dragićević, S., Novković, I., & Jakovljević, T. (2025). D4.1 Izveštaj o životnoj sredini u Srbiji. https://popenviros-prizma.com/library-2/reports/
Drobnjaković, M., Panić, M., & Đorđević, J. (2016). Traditional undeveloped municipalities in Serbia as a result of regional inequality. European Planning Studies, 24(5), 926-949. https://doi.org/10.1080/09654313.2015.1129396
Eurostat. (2025). NUTS – Nomenclature of territorial units for statistics: Correspondence tables. https://ec.europa.eu/eurostat/web/nuts/correspondence-tables
Filipović, L., Putniković, S., Stosic, B., Stosic, T., Djurdjević, V., & Tošić, I. (2025). Analysis of spatio-temporal characteristics of drought in Serbia from 1961 to 2020 using SPI and SPEI. International Journal of Climatology, 45(7), e8803. https://doi.org/10.1002/joc.8803
Freihardt, J. (2025). Environmental shocks and migration among a climate-vulnerable population in Bangladesh. Population and Environment, 47, 6. https://doi.org/10.1007/s11111-025-00478-7
García-León, D., Masselot, P., Mistry, M. N., Gasparrini, A., Motta, C., Feyen, L., & Ciscar, J.-C. (2024). Temperature-related mortality burden and projected change in 1368 European regions: A modelling study. The Lancet Public Health, 9(9), e644-e653. https://doi.org/10.1016/S2468-2667(24)00179-8
Ghosh, R. C., & Orchiston, C. (2022). A systematic review of climate migration research: Gaps in existing literature. SN Social Sciences, 2, 47. https://doi.org/10.1007/s43545-022-00341-8
Gligorijević, V., & Bakić, D. (2025). Planska i normativna zaštita prostora i životne sredine – Zbornik radova (D. Filipović, V. Šećerov, D. Ristić, & M. Ilić, Eds.). https://doi.org/10.5937/PNZPZS25275G
Henry, S., Schoumaker, B., & Beauchemin, C. (2004). The impact of rainfall on the first out-migration: A multi-level event-history analysis in Burkina Faso. Population and Environment, 25(5), 423-460. https://doi.org/10.1023/B:POEN.0000036928.17696.e8
Hermans, K., & McLeman, R. (2021). Climate change, drought, land degradation and migration: Exploring the linkages. Current Opinion in Environmental Sustainability, 50, 236-244. https://doi.org/10.1016/j.cosust.2021.04.013
Jeremić, V., Janković, V., Maričić, M., & Labus, A. (2025). 2025 6th International Workshop on Engineering Technologies and Computer Science (EnT). 2025 6th International Workshop on Engineering Technologies and Computer Science (EnT), Saint Petersburg, Russia. https://doi.org/10.1109/EnT68818.2025.11269596
Joksimović, M., & Golić, R. (2017). Indicators of regional inequality in Serbia. Collection of Papers – Faculty of Geography at the University of Belgrade, 65(1a), 227-249. https://doi.org/10.5937/zrgfub1765227J
Jovanović, T., Mitrović, K., & Erdei, I. (2023). Moving while waiting for the future: Mobility and education in Šid, Serbia. Journal of Borderlands Studies, 38(2), 229-246. https://doi.org/10.1080/08865655.2022.2048679
Kaiser, S. (2011). Biclustering: Methods, Software and Application. https://doi.org/10.5282/edoc.13073
Karutz, R., & Kabisch, S. (2023). Exploring the relationship between droughts and rural-to-urban mobility—A mixed methods approach for Pune, India. Frontiers in Climate, 5, 1168584. https://doi.org/10.3389/fclim.2023.1168584
Leisch, F., & De Troyer, E. (2020). Biclust: BiCluster Algorithms. https://doi.org/10.32614/CRAN.package.biclust
Lindenmayer, D. B., Likens, G. E., Andersen, A., Bowman, D., Bull, C. M., Burns, E., Dickman, C. R., Hoffmann, A. A., Keith, D. A., Liddell, M. J., Lowe, A. J., Metcalfe, D. J., Phinn, S. R., Russell-Smith, J., Thurgate, N., & Wardle, G. M. (2012). Value of long-term ecological studies. Austral Ecology, 37(7), 745-757. https://doi.org/10.1111/j.1442-9993.2011.02351.x
Lu, Z. (2025). Clustering longitudinal data: A review of methods and software packages. International Statistical Review, 93(3), 425-458. https://doi.org/10.1111/insr.12588
Malinić, V., Sedlak, M., Krstić, F., Joksimović, M., Golić, R., Gajić, M., Vujadinović, S., & Šabić, D. (2025). Land cover changes in the rural border region of Serbia affected by demographic dynamics. Land, 14(8), 1663. https://doi.org/10.3390/land14081663
Marinković, I., & Potić, I. (2025). The impact of low temperatures on mortality in Vojvodina (2000–2020): A quantitative analysis of cold spells. International Journal of Biometeorology, 69(9), 2237-2247. https://doi.org/10.1007/s00484-025-02960-1
Matthews, T., & Potts, R. (2018). Planning for climigration: A framework for effective action. Climatic Change, 148(4), 607-621. https://doi.org/10.1007/s10584-018-2205-3
Mersha, A. A., & van Laerhoven, F. (2016). A gender approach to understanding the differentiated impact of barriers to adaptation: Responses to climate change in rural Ethiopia. Regional Environmental Change, 16(6), 1701-1713. https://doi.org/10.1007/s10113-015-0921-z
Ministarstvo poljoprivrede i zaštite životne sredine. (2017). Izazovi klimatskih promena na teritoriji Beograda i Republike Srbije. https://www.ekologija.gov.rs/lat/saopstenja/vesti/izazovi-klimatskih-promena-na-teritoriji-beograda-i-republike-srbije
Ministry of Environmental Protection. (2022). Digital climate and climate change atlas of the Republic of Serbia [Data set]. https://atlas-klime.eko.gov.rs/eng/files
Ministry of Interior of the Republic of Serbia. (2025). Disaster Risk Register of the Republic of Serbia. https://drr.geosrbija.rs/drr/
Mirić, N. (2026). The effect of hot days on birth rates in Serbia: Regional aspect. Spatial Demography, 14, 2. https://doi.org/10.1007/s40980-025-00155-1
Molla, A. (2025). Extreme heat and human fertility: Amplified challenges in the era of climate change. Journal of Thermal Biology, 130, 104158. https://doi.org/10.1016/j.jtherbio.2025.104158
Molnar, D., & Jandrić, M. (2019). Unutarregionalne nejednakosti u Srbiji – testiranje klupske konvergencije [Intraregional inequalities in Serbia: Testing the club convergence]. Zbornik Matice Srpske Za društvene Nauke, 70(169), 91-108. https://doi.org/10.2298/ZMSDN1969091M
Nikitović, V. (Ed.). (2025). Stanovništvo Srbije – dinamika i strukture. Republički zavod za statistiku. https://publikacije.stat.gov.rs/G2025/Pdf/G20254001.pdf
Osland, M. J., Chivoiu, B., Enwright, N. M., Thorne, K. M., Guntenspergen, G. R., Grace, J. B., Dale, L. L., Brooks, W., Herold, N., Day, J. W., Sklar, F. H., & Swarzenzki, C. M. (2022). Migration and transformation of coastal wetlands in response to rising seas. Science Advances, 8(26), eabo5174. https://doi.org/10.1126/sciadv.abo5174
Piguet, E., Kaenzig, R., & Guélat, J. (2018). The uneven geography of research on “environmental migration”. Population and Environment, 39(4), 357-383. https://doi.org/10.1007/s11111-018-0296-4
Pontes, B., Giráldez, R., & Aguilar-Ruiz, J. S. (2015). Biclustering on expression data: A review. Journal of Biomedical Informatics, 57, 163-180. https://doi.org/10.1016/j.jbi.2015.06.028
Pradhan, K. C., & Narayanan, K. (2020). Weather variation and temporary labor migration: A panel data analysis for select semi-arid villages in India. Migration and Development, 9(2), 291-322. https://doi.org/10.1080/21632324.2019.1605745
Predojević-Despić, J., & Penev, G. (2016). Population of Serbia abroad by destination countries: Regional approach. Bulletin of the Serbian Geographical Society, 96(2), 83-106. https://doi.org/10.2298/GSGD1602082P
Project team ECA&D. (2013). European Climate Assessment & Dataset (ECA&D): Algorithm Theoretical Basis Document (ATBD). Royal Netherlands Meteorological Institute KNMI. https://www.ecad.eu/documents/atbd.pdf
Republic Geodetic Authority. (2023). Administrative spatial datasets [Data set]. GeoSrbija geoportal. https://download.geosrbija.rs/download/download
Sarkar, B. (2025). An assessment of the impact of temporary migration on household adaptive capacity to climate variability (e.g., drought) in rural India. Rural and Regional Development, 3(3), 10010. https://doi.org/10.70322/rrd.2025.10010
Sarkar, B., Dutta, S., & Singh, P. K. (2022). Drought and temporary migration in rural India: A comparative study across different socio-economic groups with a cross-sectional nationally representative dataset. PLOS ONE, 17(10), e0275449. https://doi.org/10.1371/journal.pone.0275449
Singh, R., Singh, H., & Raghubanshi, A. S. (2019). Challenges and opportunities for agricultural sustainability in changing climate scenarios: A perspective on Indian agriculture. Tropical Ecology, 60(2), 167-185. https://doi.org/10.1007/s42965-019-00029-w
Spalević, A. (2009). Mogućnosti za razvoj ruralnog područja u Republici Srbiji. Journal of the Geographical Institute “Jovan Cvijić” SASA, 59(2), 133-147. https://doi.org/10.2298/IJGI0902133S
Stamenković, M., Milanović, M., & Janković-Milić, V. (2021). Multivariate statistical analysis of regional economic disparities at district level in Serbia. TEME, 45(2), 681-698. https://doi.org/10.22190/TEME200715039S
Statistical Office of the Republic of Serbia. (2025). Population of Serbia - dynamics and structures, 2022. https://www.stat.gov.rs/en-us/publikacije/publication/?p=17245&tip=4
Stojanović, D., Orlović, S., Zlatković, M., Kostić, S., Vasić, V., Miletić, B., Kesić, L., Matović, B., Božanić, D., Pavlović, L., Milović, M., Pekeč, S., & Đurđević, V. (2021). Climate change within Serbian forests: Current state and future perspectives. Topola/Poplar, 208, 39-56. https://doi.org/10.5937/topola2108039S
Stojilković Gnjatović, J., Todorović, N., Vračević, M., & Devedžić, M. (2025). Book of Abstracts of the International Scientific Conference “Population and Environment: Challenges and Perspectives” (N. Mirić, Ed.).
Stosic, B., Djurdjević, V., Tošić, M., Lazić, I., Tošić, I., & Stosic, T. (2024). Generalized weighted permutation entropy analysis of SPEI index in Serbia as a proxy of corn production. International Journal of Climatology, 44(10), 3514-3528. https://doi.org/10.1002/joc.8536
Stosic, T., Tošić, I., Lazić, I., Tošić, M., Filipović, L., Djurdjević, V., & Stosic, B. (2024). Multifractal analysis of Standardized Precipitation Evapotranspiration Index in Serbia in the context of climate change. Sustainability, 16(22), 9857. https://doi.org/10.3390/su16229857
Thalheimer, L., Choquette-Levy, N., & Garip, F. (2022). Compound impacts from droughts and structural vulnerability on human mobility. IScience, 25(12), 105491. https://doi.org/10.1016/j.isci.2022.105491
Todorović, M., Drobnjaković, M., & Gligić-Simeunović, A. (2010). Specifics of rural areas of Serbia from the aspects of regional development. Economics of Agriculture, 57(Spec. num. 2), 605-612. https://www.ea.bg.ac.rs/index.php/EA/article/view/1046
Vojković, G., … Gligorijević, V. (Eds.). (2022). Stanovništvo Srbije – kako upravljati demografskim izazovima. Univerzitet u Beogradu – Geografski fakultet.
Vuković, A. J., Vujadinović, M. P., Rendulić, S. M., Đurđević, V. S., Ruml, M. M., Babić, V. P., & Popović, D. P. (2018). Global warming impact on climate change in Serbia for the period 1961-2100. Thermal Science, 22(6 Part A), 2267-2280. https://doi.org/10.2298/TSCI180411168V
Vuković, D. (2005). Migrations of the labour force from Serbia. SEER – South-East Europe Review for Labour and Social Affairs, 8(4), 139-150. https://www.jstor.org/stable/43293135
Vuković-Vimić, A., & Vujadinović-Mandić, M. (2024). Dynamics of change of climate conditions and extreme weather events in Serbia. Matica Srpska Journal for Natural Sciences, 147, 33-45. https://doi.org/10.2298/ZMSPN2447033V
Zakon o smanjenju rizika od katastrofa i upravljanju vanrednim situacijama (2018). Službeni glasnik Republike Srbije, br. 87/2018. https://www.parlament.gov.rs/upload/archive/files/lat/pdf/zakoni/2018/3278-18-lat.pdf
Zhang, X. P., Pu, H. Z., Cao, Q., Ji, Q., Xiang, Q., Wang, W. Z., & Zhong, W. (2025). Potential drivers of human migration under climate change: A review. Applied Ecology and Environmental Research, 23(6), 10703-10734. https://doi.org/10.15666/aeer/2306_1070310734
Živanović, Z., & Gatarić, D. R. (2017). Differences in regional development on the territory of the Republic of Serbia. Bulletin of Geography. Socio-Economic Series, 35(35), 145-154. https://doi.org/10.1515/bog-2017-0010